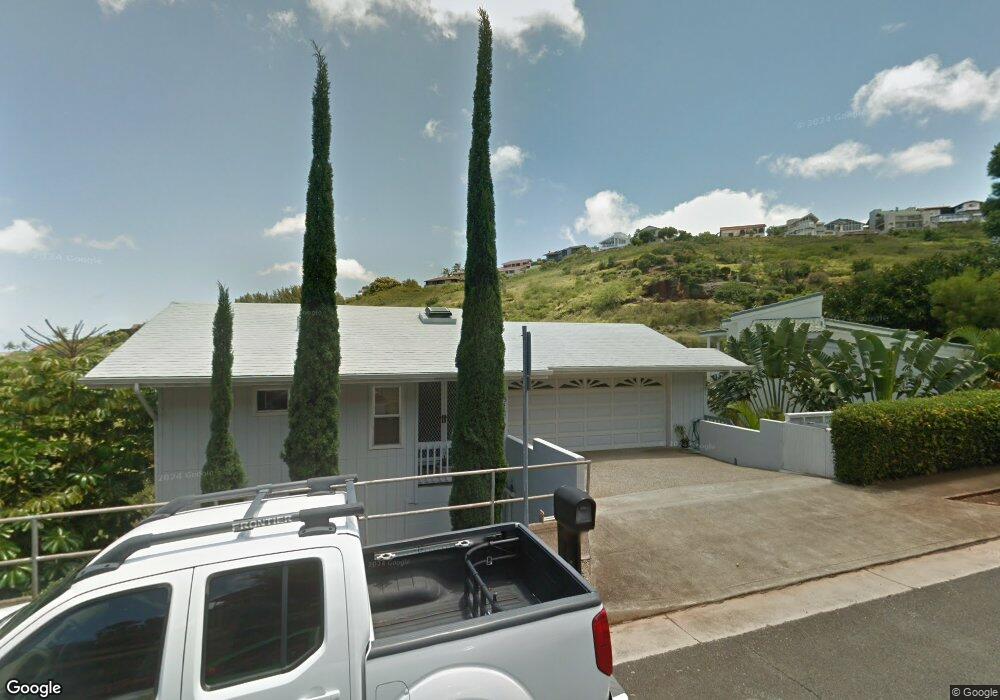
5432 Poola St Honolulu, HI 96821
Kuliouou-Kalani Iki NeighborhoodEstimated Value: $1,965,000 - $2,706,000
4
Beds
4
Baths
3,328
Sq Ft
$726/Sq Ft
Est. Value
About This Home
This home is located at 5432 Poola St, Honolulu, HI 96821 and is currently estimated at $2,417,675, approximately $726 per square foot. 5432 Poola St is a home located in Honolulu County with nearby schools including Aina Haina Elementary School, Niu Valley Middle School, and Kalani High School.
Ownership History
Date
Name
Owned For
Owner Type
Purchase Details
Closed on
Oct 28, 2005
Sold by
Radke Alan Quenton and Radke Kim Peitersen
Bought by
Goya Allen Wayne Kazuo and Goya Gayle Tsuyako
Current Estimated Value
Home Financials for this Owner
Home Financials are based on the most recent Mortgage that was taken out on this home.
Original Mortgage
$797,300
Outstanding Balance
$428,272
Interest Rate
5.72%
Mortgage Type
Fannie Mae Freddie Mac
Estimated Equity
$1,989,403
Purchase Details
Closed on
Mar 21, 2003
Sold by
Habegger Hans and Habegger Jean
Bought by
Radke Alan Quenton and Radke Kim Peitersen
Home Financials for this Owner
Home Financials are based on the most recent Mortgage that was taken out on this home.
Original Mortgage
$480,000
Interest Rate
4.58%
Purchase Details
Closed on
May 1, 1997
Sold by
Habegger Jean
Bought by
Habegger Jean
Create a Home Valuation Report for This Property
The Home Valuation Report is an in-depth analysis detailing your home's value as well as a comparison with similar homes in the area
Home Values in the Area
Average Home Value in this Area
Purchase History
| Date | Buyer | Sale Price | Title Company |
|---|---|---|---|
| Goya Allen Wayne Kazuo | $1,139,000 | Fhtc | |
| Radke Alan Quenton | $650,000 | -- | |
| Habegger Jean | -- | -- | |
| Habegger Hans | -- | -- | |
| Habegger Hans | -- | -- | |
| Habegger Jean | -- | -- | |
| Habegger Hans | -- | -- | |
| Habegger Hans | -- | -- |
Source: Public Records
Mortgage History
| Date | Status | Borrower | Loan Amount |
|---|---|---|---|
| Open | Goya Allen Wayne Kazuo | $797,300 | |
| Previous Owner | Radke Alan Quenton | $480,000 |
Source: Public Records
Tax History
| Year | Tax Paid | Tax Assessment Tax Assessment Total Assessment is a certain percentage of the fair market value that is determined by local assessors to be the total taxable value of land and additions on the property. | Land | Improvement |
|---|---|---|---|---|
| 2025 | $6,127 | $2,060,300 | $1,359,500 | $700,800 |
| 2024 | $6,127 | $1,910,600 | $1,285,400 | $625,200 |
| 2023 | $5,793 | $1,895,200 | $1,235,900 | $659,300 |
| 2022 | $5,324 | $1,661,000 | $1,128,800 | $532,200 |
| 2021 | $9,972 | $1,521,100 | $1,087,600 | $433,500 |
| 2020 | $10,532 | $1,574,500 | $1,087,600 | $486,900 |
| 2019 | $9,689 | $1,494,200 | $955,800 | $538,400 |
| 2018 | $8,164 | $1,407,100 | $906,400 | $500,700 |
| 2017 | $7,766 | $1,362,900 | $840,400 | $522,500 |
| 2016 | $8,192 | $1,365,300 | $873,400 | $491,900 |
| 2015 | $7,628 | $1,271,300 | $758,000 | $513,300 |
| 2014 | $3,604 | $1,213,600 | $697,800 | $515,800 |
Source: Public Records
Map
Nearby Homes
- 5442 Poola St
- 5436 Poola St
- 5404 Poola St
- 5201 Kuaiwi Place
- 5333 Puahia Place
- 5197 Poola St
- 523 Kiholo St
- 1410 Ehupua St
- 809 Hao St
- 1630 Kalaniiki St Unit 31
- 1455 Kalanikai Place Unit 40
- 888 Ahuwale St
- 953 Ailuna St
- 855 Kainoa Place
- 360 Puuikena Dr
- 269 Kaialii Place
- 5446 Kirkwood Place
- 167 Maono Place
- 1947 Alaeloa St
- 97 Moaniala Place
- 5422 Poola St Unit 2713
- 0000 Poola St
- 5412 Poola St
- 5448 Poola St
- 5208 Kuaiwi Place
- 5222 Kuaiwi Place
- 5216 Kuaiwi Place
- 5200 Kuaiwi Place
- 5230 Kuaiwi Place
- 5413 Poola St
- 5454 Poola St
- 5405 Poola St
- 5238 Kuaiwi Place
- 5396 Poola St
- 5460 Poola St
- 5209 Kuaiwi Place
- 5213 Kuaiwi Place
- 5399 Poola St
- 5246 Kuaiwi Place
- 5466 Poola St
Your Personal Tour Guide
Ask me questions while you tour the home.