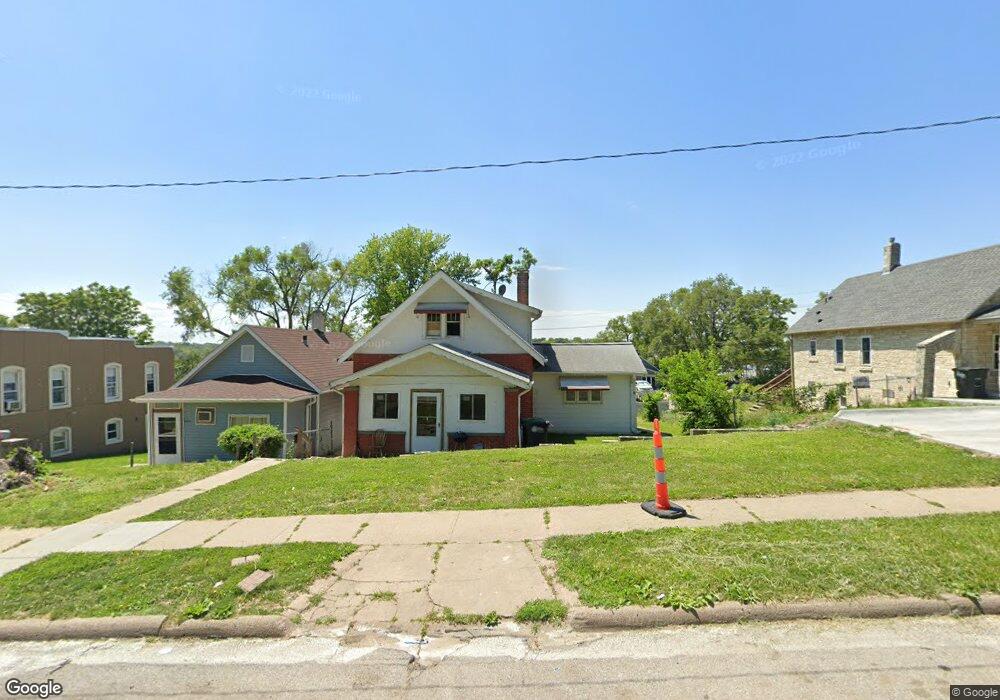
5432 S 23rd St Omaha, NE 68107
Brown Park NeighborhoodEstimated Value: $160,579 - $178,000
2
Beds
2
Baths
1,310
Sq Ft
$132/Sq Ft
Est. Value
About This Home
This home is located at 5432 S 23rd St, Omaha, NE 68107 and is currently estimated at $172,645, approximately $131 per square foot. 5432 S 23rd St is a home located in Douglas County with nearby schools including Gomez Heritage Elementary School, R.M. Marrs Magnet Middle School, and South High Magnet School.
Ownership History
Date
Name
Owned For
Owner Type
Purchase Details
Closed on
Oct 10, 2014
Sold by
Ramos Virginia and Ruiz Virginia
Bought by
Ruiz Virginia
Current Estimated Value
Purchase Details
Closed on
May 22, 2009
Sold by
Ramos Rodolfo
Bought by
Ramos Virginia
Purchase Details
Closed on
Jul 25, 2003
Sold by
Kocsis Paul
Bought by
Ramos Rodolfo and Ramos Virginia
Home Financials for this Owner
Home Financials are based on the most recent Mortgage that was taken out on this home.
Original Mortgage
$69,300
Interest Rate
6.08%
Mortgage Type
Purchase Money Mortgage
Create a Home Valuation Report for This Property
The Home Valuation Report is an in-depth analysis detailing your home's value as well as a comparison with similar homes in the area
Home Values in the Area
Average Home Value in this Area
Purchase History
| Date | Buyer | Sale Price | Title Company |
|---|---|---|---|
| Ruiz Virginia | -- | None Available | |
| Ramos Virginia | $90,000 | None Available | |
| Ramos Rodolfo | $77,000 | -- |
Source: Public Records
Mortgage History
| Date | Status | Borrower | Loan Amount |
|---|---|---|---|
| Previous Owner | Ramos Rodolfo | $69,300 |
Source: Public Records
Tax History
| Year | Tax Paid | Tax Assessment Tax Assessment Total Assessment is a certain percentage of the fair market value that is determined by local assessors to be the total taxable value of land and additions on the property. | Land | Improvement |
|---|---|---|---|---|
| 2025 | $1,915 | $116,800 | $13,900 | $102,900 |
| 2024 | $2,276 | $116,800 | $13,900 | $102,900 |
| 2023 | $2,276 | $107,900 | $13,900 | $94,000 |
| 2022 | $2,154 | $100,900 | $6,900 | $94,000 |
| 2021 | $1,549 | $73,200 | $6,900 | $66,300 |
| 2020 | $1,589 | $74,200 | $6,900 | $67,300 |
| 2019 | $1,593 | $74,200 | $6,900 | $67,300 |
| 2018 | $1,400 | $65,100 | $6,900 | $58,200 |
| 2016 | $1,365 | $63,600 | $5,400 | $58,200 |
Source: Public Records
Map
Nearby Homes
Your Personal Tour Guide
Ask me questions while you tour the home.