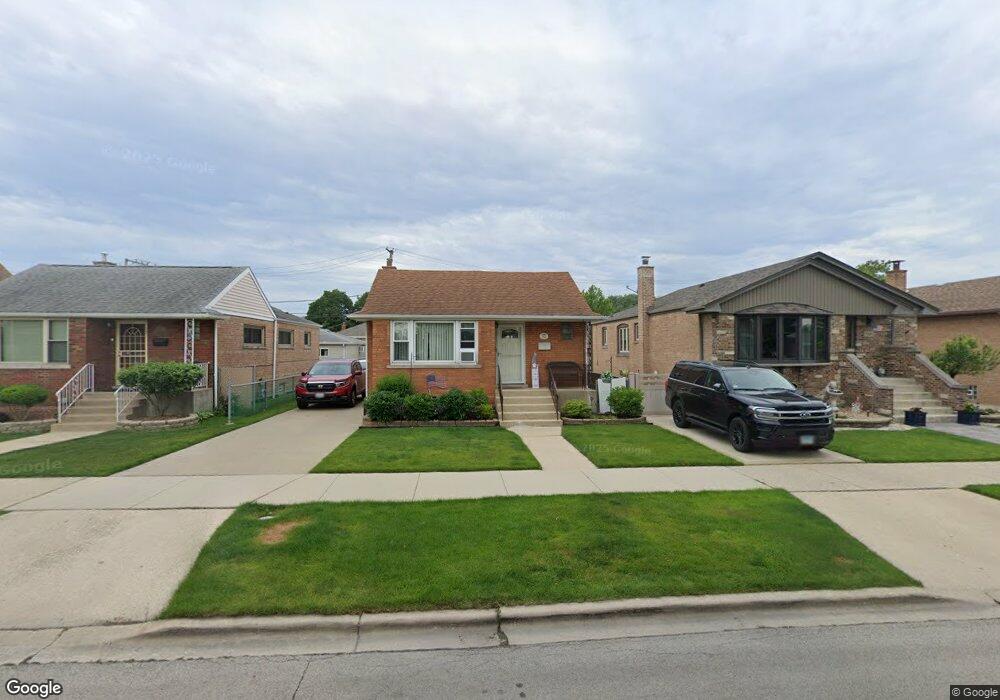
5432 S Nagle Ave Chicago, IL 60638
Garfield Ridge NeighborhoodEstimated Value: $298,000 - $368,000
3
Beds
1
Bath
1,093
Sq Ft
$316/Sq Ft
Est. Value
About This Home
This home is located at 5432 S Nagle Ave, Chicago, IL 60638 and is currently estimated at $345,159, approximately $315 per square foot. 5432 S Nagle Ave is a home located in Cook County with nearby schools including Byrne Elementary School, Kennedy High School, and St Daniel The Prophet School.
Ownership History
Date
Name
Owned For
Owner Type
Purchase Details
Closed on
Sep 8, 1999
Sold by
Calzaretta George E and Calzaretta Marianne H
Bought by
Larkner Robert W and Larkner Deborah A
Current Estimated Value
Home Financials for this Owner
Home Financials are based on the most recent Mortgage that was taken out on this home.
Original Mortgage
$118,000
Outstanding Balance
$34,849
Interest Rate
7.77%
Estimated Equity
$310,310
Purchase Details
Closed on
Mar 2, 1998
Sold by
Caizaretta George L
Bought by
Calzaretta George E and Calzaretta Marianne H
Purchase Details
Closed on
Sep 26, 1994
Sold by
Kuzniar Anthony M and Kuzniar Helen P
Bought by
Calzaretta George E
Home Financials for this Owner
Home Financials are based on the most recent Mortgage that was taken out on this home.
Original Mortgage
$95,000
Interest Rate
8.6%
Create a Home Valuation Report for This Property
The Home Valuation Report is an in-depth analysis detailing your home's value as well as a comparison with similar homes in the area
Home Values in the Area
Average Home Value in this Area
Purchase History
| Date | Buyer | Sale Price | Title Company |
|---|---|---|---|
| Larkner Robert W | $148,000 | Chicago Title Insurance Co | |
| Calzaretta George E | -- | -- | |
| Calzaretta George E | $125,000 | Intercounty Title |
Source: Public Records
Mortgage History
| Date | Status | Borrower | Loan Amount |
|---|---|---|---|
| Open | Larkner Robert W | $118,000 | |
| Previous Owner | Calzaretta George E | $95,000 |
Source: Public Records
Tax History Compared to Growth
Tax History
| Year | Tax Paid | Tax Assessment Tax Assessment Total Assessment is a certain percentage of the fair market value that is determined by local assessors to be the total taxable value of land and additions on the property. | Land | Improvement |
|---|---|---|---|---|
| 2024 | $3,613 | $29,000 | $7,000 | $22,000 |
| 2023 | $3,484 | $23,000 | $6,250 | $16,750 |
| 2022 | $3,484 | $23,000 | $6,250 | $16,750 |
| 2021 | $3,420 | $23,000 | $6,250 | $16,750 |
| 2020 | $3,398 | $20,740 | $5,000 | $15,740 |
| 2019 | $3,966 | $23,045 | $5,000 | $18,045 |
| 2018 | $4,318 | $25,152 | $5,000 | $20,152 |
| 2017 | $3,591 | $19,945 | $4,500 | $15,445 |
| 2016 | $3,518 | $19,945 | $4,500 | $15,445 |
| 2015 | $3,197 | $19,945 | $4,500 | $15,445 |
| 2014 | $2,789 | $17,485 | $4,250 | $13,235 |
| 2013 | $2,724 | $17,485 | $4,250 | $13,235 |
Source: Public Records
Map
Nearby Homes
- 5421 S Mulligan Ave
- 6340 S Archer Ave
- 5519 S Nashville Ave
- 5250 S Nagle Ave
- 5248 S Narragansett Ave
- 5253 S Mobile Ave
- 5417 S Melvina Ave Unit 102
- 5536 S Normandy Ave
- 5637 S Natoma Ave
- 5142 S Mulligan Ave
- 5653 S Normandy Ave
- 5118 S Mobile Ave
- 5112 S Nashville Ave
- 5141 S Merrimac Ave
- 5427 S Newcastle Ave
- 5621 S Moody Ave
- 5137 S Rutherford Ave
- 5622 S Oak Park Ave
- 5823 S Mulligan Ave
- 5520 S New England Ave
- 5436 S Nagle Ave
- 5428 S Nagle Ave
- 5440 S Nagle Ave
- 5424 S Nagle Ave
- 5444 S Nagle Ave
- 5420 S Nagle Ave
- 5437 S Natchez Ave
- 5439 S Natchez Ave
- 5427 S Natchez Ave
- 5416 S Nagle Ave
- 5441 S Natchez Ave
- 5425 S Natchez Ave
- 5421 S Natchez Ave
- 5433 S Nagle Ave
- 5437 S Nagle Ave
- 5429 S Nagle Ave
- 5412 S Nagle Ave
- 5427 S Nagle Ave
- 5443 S Nagle Ave
- 5417 S Natchez Ave