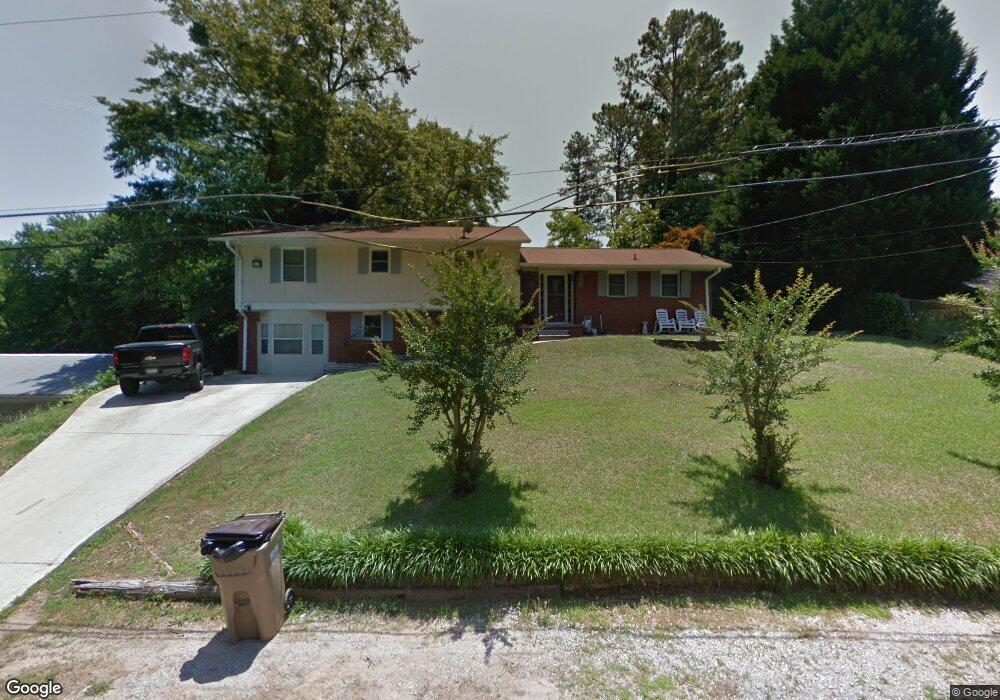
5433 Beach Haven Dr Gainesville, GA 30504
Estimated Value: $325,493 - $378,000
4
Beds
2
Baths
1,520
Sq Ft
$228/Sq Ft
Est. Value
About This Home
This home is located at 5433 Beach Haven Dr, Gainesville, GA 30504 and is currently estimated at $347,123, approximately $228 per square foot. 5433 Beach Haven Dr is a home located in Hall County with nearby schools including McEver Elementary School, Chestatee Middle School, and Chestatee High School.
Ownership History
Date
Name
Owned For
Owner Type
Purchase Details
Closed on
Oct 29, 2003
Sold by
An Okhui
Bought by
An Ok Hui
Current Estimated Value
Home Financials for this Owner
Home Financials are based on the most recent Mortgage that was taken out on this home.
Original Mortgage
$116,088
Outstanding Balance
$52,882
Interest Rate
5.75%
Mortgage Type
FHA
Estimated Equity
$294,241
Purchase Details
Closed on
Oct 31, 2002
Sold by
Carnes Cathy
Bought by
Aleman Jua
Home Financials for this Owner
Home Financials are based on the most recent Mortgage that was taken out on this home.
Original Mortgage
$110,269
Interest Rate
5.95%
Mortgage Type
FHA
Purchase Details
Closed on
May 27, 1994
Sold by
Mathis Catherine S
Bought by
Carnes Cathy
Home Financials for this Owner
Home Financials are based on the most recent Mortgage that was taken out on this home.
Original Mortgage
$64,850
Interest Rate
8.27%
Create a Home Valuation Report for This Property
The Home Valuation Report is an in-depth analysis detailing your home's value as well as a comparison with similar homes in the area
Home Values in the Area
Average Home Value in this Area
Purchase History
| Date | Buyer | Sale Price | Title Company |
|---|---|---|---|
| An Ok Hui | -- | -- | |
| Aleman Jua | $112,000 | -- | |
| Carnes Cathy | $65,000 | -- |
Source: Public Records
Mortgage History
| Date | Status | Borrower | Loan Amount |
|---|---|---|---|
| Open | An Ok Hui | $116,088 | |
| Previous Owner | Aleman Jua | $110,269 | |
| Previous Owner | Carnes Cathy | $64,850 |
Source: Public Records
Tax History Compared to Growth
Tax History
| Year | Tax Paid | Tax Assessment Tax Assessment Total Assessment is a certain percentage of the fair market value that is determined by local assessors to be the total taxable value of land and additions on the property. | Land | Improvement |
|---|---|---|---|---|
| 2024 | $2,508 | $100,528 | $14,040 | $86,488 |
| 2023 | $2,027 | $96,888 | $14,040 | $82,848 |
| 2022 | $2,214 | $85,088 | $12,320 | $72,768 |
| 2021 | $1,735 | $65,288 | $8,600 | $56,688 |
| 2020 | $1,714 | $62,728 | $8,600 | $54,128 |
| 2019 | $1,636 | $59,328 | $8,600 | $50,728 |
| 2018 | $1,239 | $43,357 | $7,040 | $36,317 |
| 2017 | $1,227 | $43,357 | $7,040 | $36,317 |
| 2016 | $1,253 | $43,357 | $7,040 | $36,317 |
| 2015 | $1,263 | $43,357 | $7,040 | $36,317 |
| 2014 | $1,263 | $43,357 | $7,040 | $36,317 |
Source: Public Records
Map
Nearby Homes
- 5382 Pine Forest Rd
- 5320 Sherri Dr
- 5350 Woodland Cir
- 5391 Whiporwill Dr
- 5471 Dogwood Ln
- 5252 Trudy Cir
- 5119 Ash Cir
- 5469 Pine Forest Cir
- 4873 Goddards Ford Rd
- 5059 Whispering Pines Dr
- 4974 Goddards Ford Rd
- 4510 Browns Bridge Rd
- 5786 Hidden Cove Rd
- 4451 Flat Creek Dr
- 4469 Flat Creek Dr
- 9370 Raldon Rd
- 4134 Heidi Ln
- 9155 Greenway Ct
- 5439 Beach Haven Dr
- 5427 Beach Haven Dr
- 5348 Browns Bridge Rd
- 5342 Browns Bridge Rd
- 5352 Browns Bridge Rd
- 5445 Beach Haven Dr
- 5432 Beach Haven Dr
- 5438 Beach Haven Dr
- 5438 Beach Haven Dr
- 5340 Browns Bridge Rd
- 5419 Beach Haven Dr
- 5356 Browns Bridge Rd
- 5426 Beach Haven Dr
- 5451 Beach Haven Dr
- 5408 Dogwood Ln
- 5360 Browns Bridge Rd
- 5428 Beach Haven Dr
- 5420 Beach Haven Dr
- 0 Beach Haven Dr Unit 7566399
- 0 Beach Haven Dr Unit 7256127