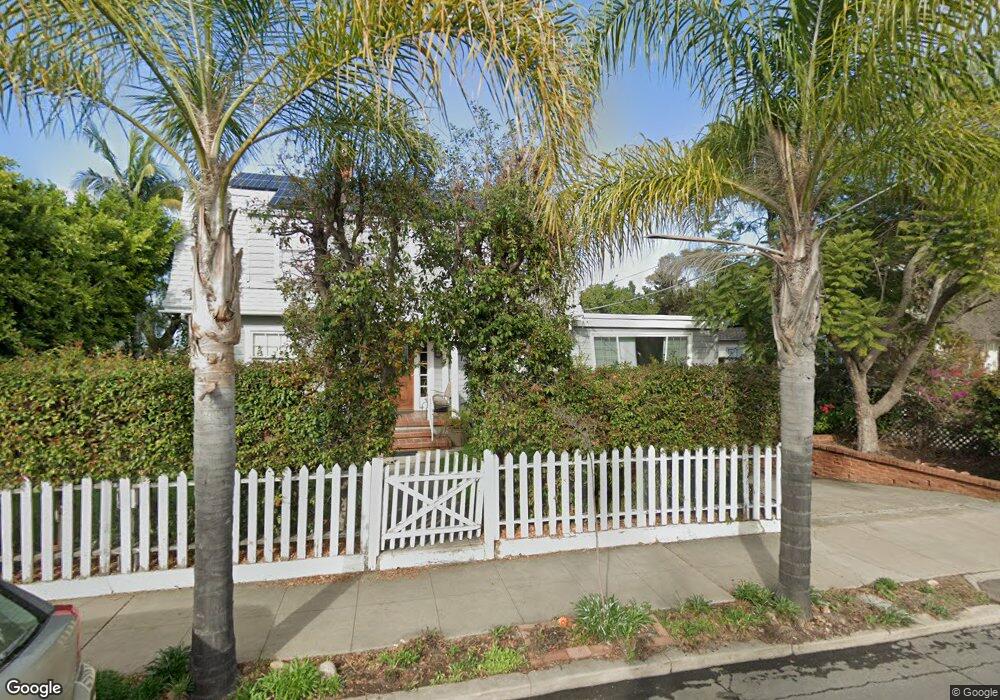
5434 Collier Ave San Diego, CA 92115
College West NeighborhoodEstimated Value: $1,183,000 - $1,244,759
4
Beds
2
Baths
2,191
Sq Ft
$550/Sq Ft
Est. Value
About This Home
This home is located at 5434 Collier Ave, San Diego, CA 92115 and is currently estimated at $1,204,440, approximately $549 per square foot. 5434 Collier Ave is a home located in San Diego County with nearby schools including Hardy Elementary School, Lewis Middle School, and Patrick Henry High School.
Ownership History
Date
Name
Owned For
Owner Type
Purchase Details
Closed on
Aug 15, 1997
Sold by
Barr Charles H and Barr Ingeborg
Bought by
Rappel Wouter Jan and Ertl Adrienne P
Current Estimated Value
Home Financials for this Owner
Home Financials are based on the most recent Mortgage that was taken out on this home.
Original Mortgage
$129,900
Outstanding Balance
$19,129
Interest Rate
7.34%
Estimated Equity
$1,185,311
Purchase Details
Closed on
Apr 15, 1997
Sold by
Richard Komisars
Bought by
Barr Charles H and Barr Ingeborg
Purchase Details
Closed on
May 4, 1995
Sold by
Barr Charles H and Barr Ingeborg
Bought by
Komisars Richard
Home Financials for this Owner
Home Financials are based on the most recent Mortgage that was taken out on this home.
Original Mortgage
$103,300
Interest Rate
8.32%
Mortgage Type
Seller Take Back
Create a Home Valuation Report for This Property
The Home Valuation Report is an in-depth analysis detailing your home's value as well as a comparison with similar homes in the area
Home Values in the Area
Average Home Value in this Area
Purchase History
| Date | Buyer | Sale Price | Title Company |
|---|---|---|---|
| Rappel Wouter Jan | $170,000 | First American Title | |
| Barr Charles H | -- | -- | |
| Komisars Richard | -- | South Coast Title Co |
Source: Public Records
Mortgage History
| Date | Status | Borrower | Loan Amount |
|---|---|---|---|
| Open | Rappel Wouter Jan | $129,900 | |
| Previous Owner | Komisars Richard | $103,300 |
Source: Public Records
Tax History Compared to Growth
Tax History
| Year | Tax Paid | Tax Assessment Tax Assessment Total Assessment is a certain percentage of the fair market value that is determined by local assessors to be the total taxable value of land and additions on the property. | Land | Improvement |
|---|---|---|---|---|
| 2025 | $3,215 | $271,261 | $185,833 | $85,428 |
| 2024 | $3,215 | $265,943 | $182,190 | $83,753 |
| 2023 | $3,142 | $260,729 | $178,618 | $82,111 |
| 2022 | $3,057 | $255,617 | $175,116 | $80,501 |
| 2021 | $3,035 | $250,606 | $171,683 | $78,923 |
| 2020 | $2,997 | $248,037 | $169,923 | $78,114 |
| 2019 | $2,943 | $243,175 | $166,592 | $76,583 |
| 2018 | $2,751 | $238,408 | $163,326 | $75,082 |
| 2017 | $80 | $233,734 | $160,124 | $73,610 |
| 2016 | $2,638 | $229,152 | $156,985 | $72,167 |
| 2015 | $2,598 | $225,710 | $154,627 | $71,083 |
| 2014 | $2,557 | $221,290 | $151,599 | $69,691 |
Source: Public Records
Map
Nearby Homes
- 5488 New Mills Rd
- 4793 54th St
- 5416 Redland Place
- 4848 54th St
- 4704 Austin Dr
- 4737 Baylor Dr
- 5640 Campanile Way
- 4810 Baylor Dr
- 5556 Baja Dr
- 4545 Collwood Blvd Unit 27
- 4545 Collwood Blvd Unit 19
- 4501 Collwood Blvd Unit 4
- 4501 Collwood Blvd Unit 9
- 5740 Adams Ave
- 4600 Collwood Ln Unit TR 5772 PAR A
- 5228 Augustana Place
- 4402 Collwood Ln
- 4881 Collwood Blvd Unit A
- 4881 Collwood Blvd Unit B
- 4891 Collwood Blvd Unit B
- 5428 Collier Ave
- 5440 Collier Ave
- 5422 Collier Ave
- 5446 Collier Ave
- 5493 New Mills Rd
- 5483 New Mills Rd
- 5416 Collier Ave
- 5450 Collier Ave
- 5433 Collier Ave
- 5439 Collier Ave
- 5427 Collier Ave
- 5445 Collier Ave
- 5421 Collier Ave
- 5473 New Mills Rd
- 5410 Collier Ave
- 5454 Collier Ave
- 5451 Collier Ave
- 5415 Collier Ave
- 4765 54th St
- 4771 54th St