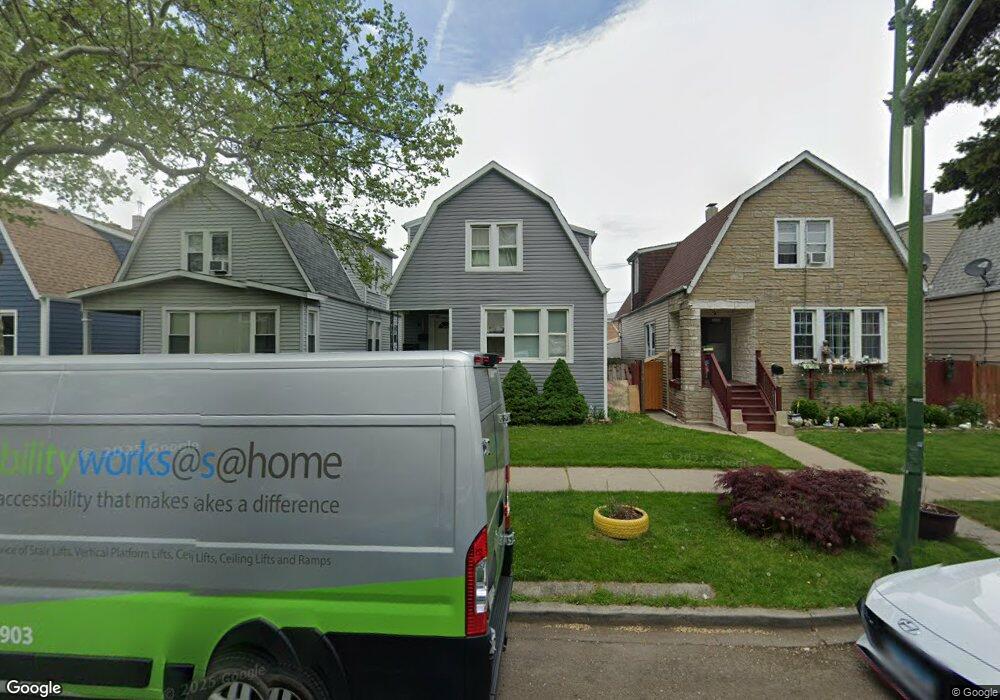
5434 W Parker Ave Chicago, IL 60639
Cragin NeighborhoodEstimated Value: $384,000 - $431,000
4
Beds
2
Baths
1,634
Sq Ft
$250/Sq Ft
Est. Value
About This Home
This home is located at 5434 W Parker Ave, Chicago, IL 60639 and is currently estimated at $409,058, approximately $250 per square foot. 5434 W Parker Ave is a home located in Cook County with nearby schools including Schubert Elementary School, Northwest Middle School, and Foreman College and Career Academy.
Ownership History
Date
Name
Owned For
Owner Type
Purchase Details
Closed on
Sep 11, 2009
Sold by
Fannie Mae
Bought by
Brito Cesar and Nieves Lucina
Current Estimated Value
Home Financials for this Owner
Home Financials are based on the most recent Mortgage that was taken out on this home.
Original Mortgage
$98,188
Outstanding Balance
$64,215
Interest Rate
5.19%
Mortgage Type
FHA
Estimated Equity
$344,843
Purchase Details
Closed on
Dec 11, 2007
Sold by
Gaya
Bought by
Federal National Mortgage Association
Purchase Details
Closed on
Feb 16, 2005
Sold by
Soto Marco Antonio and Soto Maria
Bought by
Gaya Rose
Home Financials for this Owner
Home Financials are based on the most recent Mortgage that was taken out on this home.
Original Mortgage
$63,000
Interest Rate
5.71%
Mortgage Type
Credit Line Revolving
Purchase Details
Closed on
Apr 6, 2003
Sold by
Chaparro Jenny G
Bought by
Soto Marco Antonio and Soto Maria
Home Financials for this Owner
Home Financials are based on the most recent Mortgage that was taken out on this home.
Original Mortgage
$328,500
Interest Rate
5.5%
Mortgage Type
Adjustable Rate Mortgage/ARM
Purchase Details
Closed on
Sep 25, 2001
Sold by
Vega Gloria
Bought by
Chaparro Jenny G
Home Financials for this Owner
Home Financials are based on the most recent Mortgage that was taken out on this home.
Original Mortgage
$231,420
Interest Rate
6.99%
Mortgage Type
FHA
Purchase Details
Closed on
Jan 7, 2000
Sold by
Espinosa Neyda F
Bought by
Vega Gloria
Home Financials for this Owner
Home Financials are based on the most recent Mortgage that was taken out on this home.
Original Mortgage
$196,682
Interest Rate
7.98%
Mortgage Type
FHA
Purchase Details
Closed on
Nov 5, 1998
Sold by
Delgado Feliciano and Quijano Mario
Bought by
Espinosa Neyda F
Home Financials for this Owner
Home Financials are based on the most recent Mortgage that was taken out on this home.
Original Mortgage
$171,835
Interest Rate
6.59%
Mortgage Type
FHA
Purchase Details
Closed on
Jan 31, 1997
Sold by
Salem Issam
Bought by
Delgado Feliciano and Quijano Mario
Home Financials for this Owner
Home Financials are based on the most recent Mortgage that was taken out on this home.
Original Mortgage
$151,074
Interest Rate
7.93%
Mortgage Type
FHA
Purchase Details
Closed on
Aug 5, 1996
Sold by
Lona John
Bought by
Salem Issam
Home Financials for this Owner
Home Financials are based on the most recent Mortgage that was taken out on this home.
Original Mortgage
$92,025
Interest Rate
8.47%
Mortgage Type
FHA
Create a Home Valuation Report for This Property
The Home Valuation Report is an in-depth analysis detailing your home's value as well as a comparison with similar homes in the area
Home Values in the Area
Average Home Value in this Area
Purchase History
| Date | Buyer | Sale Price | Title Company |
|---|---|---|---|
| Brito Cesar | -- | Git | |
| Federal National Mortgage Association | -- | None Available | |
| Gaya Rose | $315,000 | Multiple | |
| Soto Marco Antonio | $265,000 | Chicago Title Insurance Co | |
| Soto Marco Antonio | $265,000 | Chicago Title Insurance Co | |
| Chaparro Jenny G | $245,000 | -- | |
| Vega Gloria | $199,000 | -- | |
| Espinosa Neyda F | $175,000 | -- | |
| Delgado Feliciano | $153,500 | -- | |
| Salem Issam | -- | -- |
Source: Public Records
Mortgage History
| Date | Status | Borrower | Loan Amount |
|---|---|---|---|
| Open | Brito Cesar | $98,188 | |
| Previous Owner | Gaya Rose | $63,000 | |
| Previous Owner | Gaya Rose | $252,000 | |
| Previous Owner | Soto Marco Antonio | $328,500 | |
| Previous Owner | Chaparro Jenny G | $231,420 | |
| Previous Owner | Vega Gloria | $196,682 | |
| Previous Owner | Espinosa Neyda F | $171,835 | |
| Previous Owner | Delgado Feliciano | $151,074 | |
| Previous Owner | Salem Issam | $92,025 |
Source: Public Records
Tax History Compared to Growth
Tax History
| Year | Tax Paid | Tax Assessment Tax Assessment Total Assessment is a certain percentage of the fair market value that is determined by local assessors to be the total taxable value of land and additions on the property. | Land | Improvement |
|---|---|---|---|---|
| 2024 | $5,423 | $37,001 | $6,938 | $30,063 |
| 2023 | $5,265 | $29,000 | $5,625 | $23,375 |
| 2022 | $5,265 | $29,000 | $5,625 | $23,375 |
| 2021 | $5,166 | $29,003 | $5,628 | $23,375 |
| 2020 | $5,225 | $26,544 | $4,687 | $21,857 |
| 2019 | $5,306 | $29,825 | $4,687 | $25,138 |
| 2018 | $5,216 | $29,825 | $4,687 | $25,138 |
| 2017 | $5,250 | $27,750 | $4,125 | $23,625 |
| 2016 | $5,061 | $27,750 | $4,125 | $23,625 |
| 2015 | $4,607 | $27,750 | $4,125 | $23,625 |
| 2014 | $3,792 | $22,993 | $3,750 | $19,243 |
| 2013 | $4,185 | $22,993 | $3,750 | $19,243 |
Source: Public Records
Map
Nearby Homes
- 5505 W Parker Ave
- 5330 W Drummond Place
- 2939 N Lotus Ave
- 5303 W George St
- 5254 W Wolfram St
- 4918-22 W Diversey Ave
- 2515 N Lotus Ave
- 3024 N Long Ave
- 2510 N Linder Ave
- 2503 N Lotus Ave
- 3036 N Long Ave
- 5205 W Drummond Place Unit 1
- 2859 N Mango Ave
- 5335 W Barry Ave
- 2531 N Major Ave
- 5121 W Diversey Ave Unit 3S
- 5121 W Diversey Ave Unit 3N
- 2434 N Lorel Ave
- 2430 N Central Ave
- 2419 N Central Ave
- 5438 W Parker Ave
- 5430 W Parker Ave
- 5428 W Parker Ave
- 5440 W Parker Ave
- 5424 W Parker Ave
- 5442 W Parker Ave
- 5446 W Parker Ave
- 5422 W Parker Ave
- 5433 W Diversey Ave
- 5435 W Diversey Ave
- 5437 W Diversey Ave
- 5418 W Parker Ave
- 5448 W Parker Ave Unit 1
- 5437 W Parker Ave Unit 1
- 5439 W Parker Ave
- 5452 W Parker Ave
- 5416 W Parker Ave
- 5445 W Diversey Ave
- 5441 W Parker Ave
- 5441 W Parker Ave Unit 1