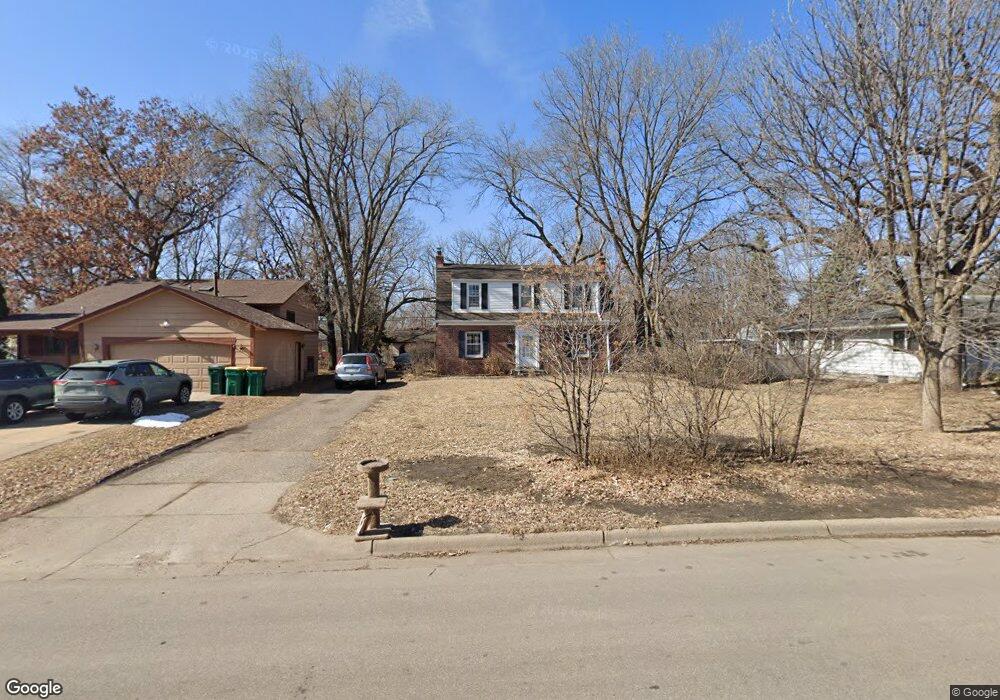
5435 Bryant Ave N Minneapolis, MN 55430
Bellvue NeighborhoodEstimated Value: $254,000 - $289,000
3
Beds
1
Bath
1,284
Sq Ft
$207/Sq Ft
Est. Value
About This Home
This home is located at 5435 Bryant Ave N, Minneapolis, MN 55430 and is currently estimated at $265,442, approximately $206 per square foot. 5435 Bryant Ave N is a home located in Hennepin County with nearby schools including Brooklyn Center Elementary STEAM, Bright Water MontessoriSchool, and KIPP North Star Primary.
Ownership History
Date
Name
Owned For
Owner Type
Purchase Details
Closed on
Aug 1, 2022
Sold by
Rozman Dina M and Rozman Thomas J
Bought by
Watson Dylan Royce
Current Estimated Value
Home Financials for this Owner
Home Financials are based on the most recent Mortgage that was taken out on this home.
Original Mortgage
$168,800
Outstanding Balance
$161,721
Interest Rate
5.78%
Mortgage Type
New Conventional
Estimated Equity
$103,721
Purchase Details
Closed on
May 25, 2018
Sold by
Rogalla Dina M
Bought by
Rogalla Dina M and Watson Dylan Royce
Purchase Details
Closed on
Mar 19, 2018
Sold by
Rogalla Leon M
Bought by
Rogalla Dina M
Home Financials for this Owner
Home Financials are based on the most recent Mortgage that was taken out on this home.
Original Mortgage
$170,500
Interest Rate
4.32%
Mortgage Type
New Conventional
Purchase Details
Closed on
Apr 28, 1999
Sold by
Thomas Kevin J and Thomas Denita C
Bought by
Rogalla Leon M and Rogalla Dina M
Create a Home Valuation Report for This Property
The Home Valuation Report is an in-depth analysis detailing your home's value as well as a comparison with similar homes in the area
Home Values in the Area
Average Home Value in this Area
Purchase History
| Date | Buyer | Sale Price | Title Company |
|---|---|---|---|
| Watson Dylan Royce | $500 | None Listed On Document | |
| Rogalla Dina M | -- | Ancon Title & Escrwo | |
| Rogalla Dina M | -- | Ancona Title & Escrow | |
| Rogalla Leon M | $110,500 | -- |
Source: Public Records
Mortgage History
| Date | Status | Borrower | Loan Amount |
|---|---|---|---|
| Open | Watson Dylan Royce | $168,800 | |
| Previous Owner | Rogalla Dina M | $170,500 |
Source: Public Records
Tax History Compared to Growth
Tax History
| Year | Tax Paid | Tax Assessment Tax Assessment Total Assessment is a certain percentage of the fair market value that is determined by local assessors to be the total taxable value of land and additions on the property. | Land | Improvement |
|---|---|---|---|---|
| 2024 | $3,966 | $193,500 | $67,000 | $126,500 |
| 2023 | $2,665 | $176,400 | $55,000 | $121,400 |
| 2022 | $2,534 | $181,000 | $61,000 | $120,000 |
| 2021 | $2,898 | $170,000 | $51,000 | $119,000 |
| 2020 | $2,835 | $170,000 | $48,000 | $122,000 |
| 2019 | $3,316 | $164,000 | $41,000 | $123,000 |
| 2018 | $2,699 | $185,000 | $50,000 | $135,000 |
| 2017 | $2,259 | $149,000 | $35,000 | $114,000 |
| 2016 | $2,462 | $146,900 | $40,000 | $106,900 |
| 2015 | $2,137 | $135,000 | $35,900 | $99,100 |
| 2014 | -- | $127,400 | $34,400 | $93,000 |
Source: Public Records
Map
Nearby Homes
- 5513 Bryant Ave N
- 5447 N 4th St
- 5527 Fremont Ave N
- 5238 Fremont Ave N
- 5654 Bryant Ave N
- 5239 N 6th St
- 1107 57th Ave N
- 5200 Aldrich Ave N
- 5524 Humboldt Ave N
- 810 57th Ave N
- 5121 Aldrich Ave N
- 5050 Emerson Ave N
- 5037 Camden Ave N
- 5818 Emerson Ave N
- 5247 James Ave N
- 5053 Girard Ave N
- 5716 James Ave N
- 5136 James Ave N
- 5118 James Ave N
- 4936 Fremont Ave N
- 5425 Bryant Ave N
- 5441 Bryant Ave N
- 5436 Colfax Ave N
- 5428 Colfax Ave N
- 5411 Bryant Ave N
- 5447 Bryant Ave N
- 5442 Colfax Ave N
- 5420 Colfax Ave N
- 5448 Colfax Ave N
- 5412 Colfax Ave N
- 5432 Bryant Ave N
- 5405 Bryant Ave N
- 5453 Bryant Ave N
- 5424 Bryant Ave N
- 5440 Bryant Ave N
- 5454 Colfax Ave N
- 5408 Colfax Ave N
- 5448 Bryant Ave N
- 5403 Bryant Ave N
- 5406 Colfax Ave N