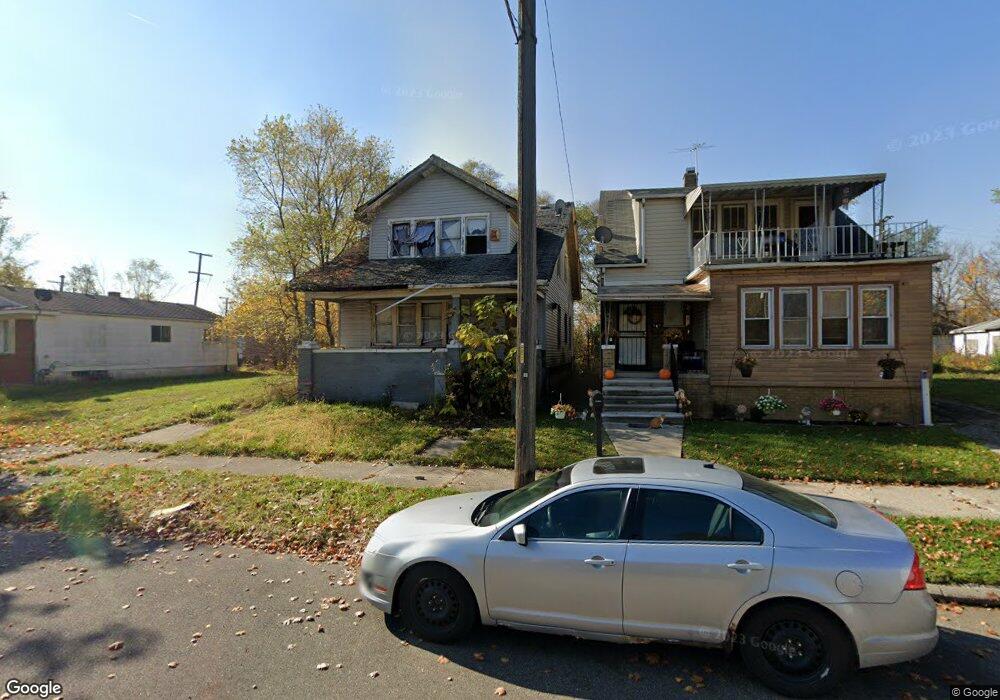
5435 Sheridan St Detroit, MI 48213
Gratiot Town-Kettering NeighborhoodEstimated Value: $41,000 - $138,000
3
Beds
1
Bath
1,440
Sq Ft
$55/Sq Ft
Est. Value
About This Home
This home is located at 5435 Sheridan St, Detroit, MI 48213 and is currently estimated at $79,721, approximately $55 per square foot. 5435 Sheridan St is a home located in Wayne County with nearby schools including Charles L. Spain Elementary-Middle School, Edward 'Duke' Ellington Conservatory of Music and Art, and Southeastern High School.
Ownership History
Date
Name
Owned For
Owner Type
Purchase Details
Closed on
Sep 23, 2024
Sold by
Detroit Land Bank Authority
Bought by
Al Masmari Mohamed
Current Estimated Value
Purchase Details
Closed on
Jun 21, 2021
Sold by
Detroit Land Bank Authority
Bought by
Jackson Donell
Purchase Details
Closed on
Jan 23, 2014
Sold by
Wayne County Treasurer
Bought by
Detroit Landbank Authority
Purchase Details
Closed on
Oct 27, 2007
Sold by
Destiny Ventures Llc
Bought by
Econohomes Llc
Purchase Details
Closed on
Sep 28, 2007
Sold by
Deutsche Bank National Trust Co
Bought by
Destiny Ventures Llc
Purchase Details
Closed on
Oct 26, 2006
Sold by
Barnett Glenda
Bought by
Deutsche Bank National Trust Co and Ameriquest Mortgage Securities Inc
Purchase Details
Closed on
Dec 5, 2003
Sold by
Robbins Milton and Robbins Valerie
Bought by
Barnett Glenda
Purchase Details
Closed on
Jun 11, 2003
Sold by
Bank One Na
Bought by
Robbins Milton
Create a Home Valuation Report for This Property
The Home Valuation Report is an in-depth analysis detailing your home's value as well as a comparison with similar homes in the area
Home Values in the Area
Average Home Value in this Area
Purchase History
| Date | Buyer | Sale Price | Title Company |
|---|---|---|---|
| Al Masmari Mohamed | $2,500 | None Listed On Document | |
| Jackson Donell | $1,000 | None Available | |
| Detroit Landbank Authority | -- | None Available | |
| Econohomes Llc | $1,000 | None Available | |
| Destiny Ventures Llc | $500 | None Available | |
| Deutsche Bank National Trust Co | $54,552 | None Available | |
| Barnett Glenda | $58,000 | Metro Title Corp | |
| Robbins Milton | $12,000 | First American Title | |
| Bank One Na | -- | First American Title |
Source: Public Records
Tax History Compared to Growth
Tax History
| Year | Tax Paid | Tax Assessment Tax Assessment Total Assessment is a certain percentage of the fair market value that is determined by local assessors to be the total taxable value of land and additions on the property. | Land | Improvement |
|---|---|---|---|---|
| 2025 | -- | $4,900 | $0 | $0 |
| 2024 | -- | $0 | $0 | $0 |
| 2023 | $0 | $0 | $0 | $0 |
| 2022 | $0 | $0 | $0 | $0 |
| 2021 | $0 | $0 | $0 | $0 |
| 2020 | $0 | $0 | $0 | $0 |
| 2019 | $835 | $0 | $0 | $0 |
| 2018 | $0 | $0 | $0 | $0 |
| 2017 | -- | $0 | $0 | $0 |
| 2016 | $240 | $0 | $0 | $0 |
| 2015 | $607 | $0 | $0 | $0 |
| 2013 | $607 | $6,072 | $0 | $0 |
| 2010 | -- | $8,901 | $432 | $8,469 |
Source: Public Records
Map
Nearby Homes
- 5437 Field St
- 1306 E Grand Blvd
- 5414-5450 Moran St
- 5245 Townsend St
- 1351 E Grand Blvd
- 5700 Townsend St
- 5155 Field St
- 5151 Field St
- 5125 Field St
- 5014 Townsend St
- 5915 Sheridan St
- 5921 Sheridan St
- 4822 Sheridan St
- 5228 Concord St
- 4804 Sheridan St
- 5102 Parker St
- 4811 Seyburn St
- 4820 Concord St
- 6112 Helen St
- 4547 Sheridan St
- 5441 Sheridan St
- 5419 Sheridan St
- 5422 Field St
- 5453 Sheridan St
- 5461 Sheridan St
- 5405 Sheridan St
- 5444 Field St
- 5416 Field St
- 5428 Field St
- 5436 Field St
- 5450 Field St
- 5408 Field St
- 5424 Sheridan St
- 5418 Sheridan St
- 5412 Sheridan St
- 5400 Field St
- 5448 Sheridan St
- 5469 Sheridan St
- 5406 Sheridan St
- 5454 Sheridan St