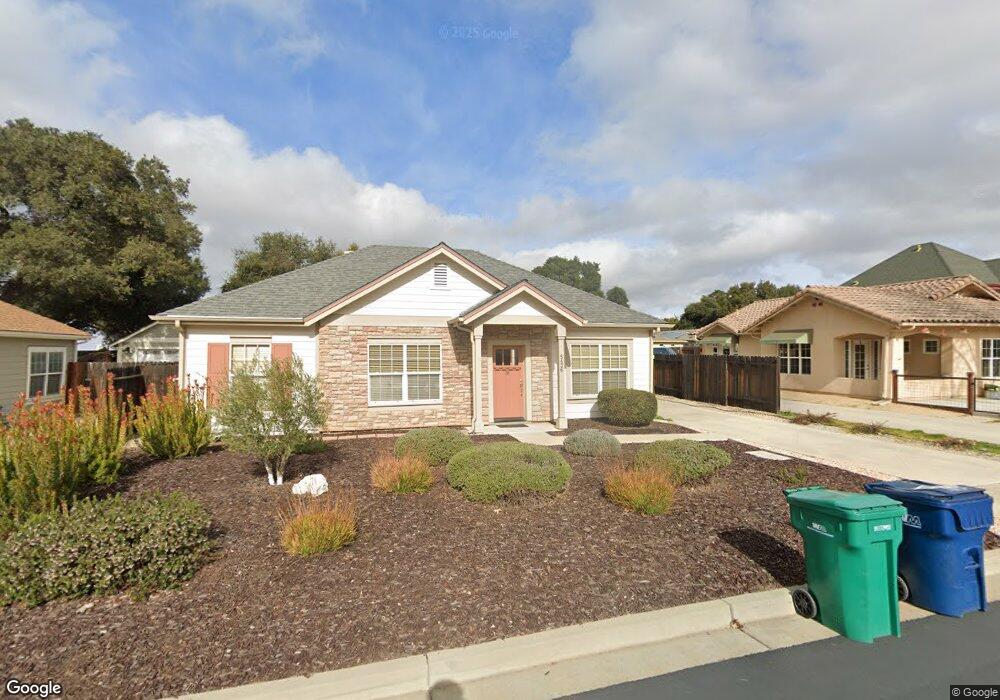
5436 Regio Place Unit 25 Atascadero, CA 93422
Estimated Value: $655,099 - $732,000
3
Beds
2
Baths
1,160
Sq Ft
$604/Sq Ft
Est. Value
About This Home
This home is located at 5436 Regio Place Unit 25, Atascadero, CA 93422 and is currently estimated at $700,275, approximately $603 per square foot. 5436 Regio Place Unit 25 is a home located in San Luis Obispo County with nearby schools including Monterey Road Elementary School, Atascadero Middle School, and Atascadero High School.
Ownership History
Date
Name
Owned For
Owner Type
Purchase Details
Closed on
Mar 27, 2018
Sold by
Layton Marjorie R and Layton Peggy J
Bought by
Segale Peggy J
Current Estimated Value
Purchase Details
Closed on
May 26, 2011
Sold by
Alta Community Development I Llc
Bought by
Layton Glenn L and Layton Marjorie R
Purchase Details
Closed on
Aug 25, 2010
Sold by
Jeremiassen Thomas P
Bought by
Alta Community Development I Llc
Purchase Details
Closed on
Jul 29, 2009
Sold by
Doya Propertied Ii Llc
Bought by
Jeremiassen Thomas P and Estate Financial
Create a Home Valuation Report for This Property
The Home Valuation Report is an in-depth analysis detailing your home's value as well as a comparison with similar homes in the area
Home Values in the Area
Average Home Value in this Area
Purchase History
| Date | Buyer | Sale Price | Title Company |
|---|---|---|---|
| Segale Peggy J | $465,000 | Fidelity National Title Co | |
| Layton Glenn L | $310,000 | Stewart Title | |
| Alta Community Development I Llc | $2,000,000 | Stewart Title | |
| Jeremiassen Thomas P | $50,000 | Accommodation |
Source: Public Records
Tax History Compared to Growth
Tax History
| Year | Tax Paid | Tax Assessment Tax Assessment Total Assessment is a certain percentage of the fair market value that is determined by local assessors to be the total taxable value of land and additions on the property. | Land | Improvement |
|---|---|---|---|---|
| 2025 | $7,113 | $529,085 | $284,454 | $244,631 |
| 2024 | $7,078 | $518,712 | $278,877 | $239,835 |
| 2023 | $7,078 | $508,542 | $273,409 | $235,133 |
| 2022 | $6,879 | $498,572 | $268,049 | $230,523 |
| 2021 | $6,653 | $488,797 | $262,794 | $226,003 |
| 2020 | $6,495 | $483,786 | $260,100 | $223,686 |
| 2019 | $6,300 | $474,300 | $255,000 | $219,300 |
| 2018 | $4,798 | $349,049 | $152,005 | $197,044 |
| 2017 | $4,720 | $342,206 | $149,025 | $193,181 |
| 2016 | $4,643 | $335,497 | $146,103 | $189,394 |
| 2015 | $4,585 | $330,459 | $143,909 | $186,550 |
| 2014 | $4,264 | $323,987 | $141,091 | $182,896 |
Source: Public Records
Map
Nearby Homes
- 1256 Camino Del Roble Unit 41
- 5424 Regio Place
- 1215 El Camino Real Unit 42
- 1215 El Camino Real Unit 61
- 1142 Galeria Cir
- 5400 Carrizo Rd
- 5715 Santa Cruz Rd Unit 49
- 6020 Del Rio Rd
- 2305 Rio Rita Rd
- 2400 El Camino Real
- 2015 Alturas Rd
- 1000 Garcia Rd
- 2400 Ramona Rd
- 2480 Ardilla Rd
- 87573 Oak St
- 2865 Ridge Rd
- 3856 Orillas Way
- 1455 Eureka Ln
- 4080 Dolores Ave
- 2955 San Fernando Rd
- 5436 Regio Place
- 5432 Regio Place Unit 24
- 5438 Regio Place Unit 26
- 5438 Regio Place
- 5428 Regio Place Unit 23
- 5428 Regio Place
- 5444 Regio Place Unit 27
- 5444 Regio Place
- 5427 Atalaya St
- 5435 Atalaya St
- 5441 Atalaya St
- 5435 Regio Place Unit 8
- 5435 Regio Place
- 5431 Regio Place Unit 9
- 5431 Regio Place
- 5448 Regio Place Unit 28
- 5448 Regio Place
- 5424 Regio Place Unit 22
- 5423 Atalaya St
- 5439 Regio Place Unit 7