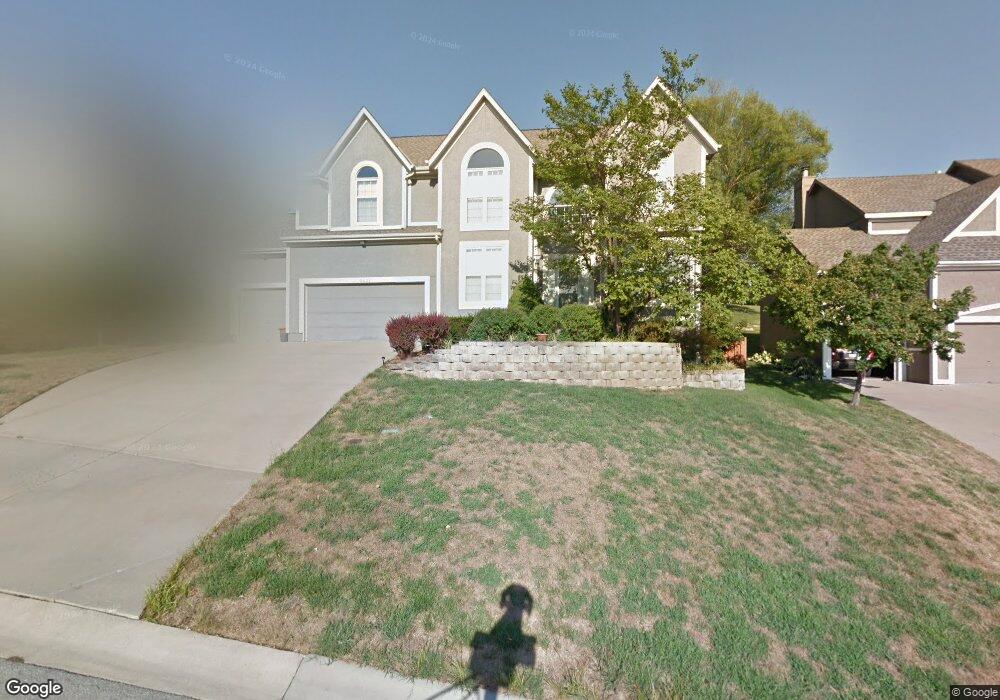
5437 Oakview St Shawnee, KS 66216
Estimated Value: $538,665 - $557,000
5
Beds
5
Baths
2,898
Sq Ft
$190/Sq Ft
Est. Value
About This Home
This home is located at 5437 Oakview St, Shawnee, KS 66216 and is currently estimated at $550,916, approximately $190 per square foot. 5437 Oakview St is a home located in Johnson County with nearby schools including Ray Marsh Elementary School, Trailridge Middle School, and Shawnee Mission Northwest High School.
Ownership History
Date
Name
Owned For
Owner Type
Purchase Details
Closed on
Feb 28, 2017
Sold by
Hendershot Todd and Hendershot Angela
Bought by
Hendershot Todd R and Todd R Hendershot Revocable Tr
Current Estimated Value
Purchase Details
Closed on
Oct 29, 2011
Sold by
Makkyla James
Bought by
Makkyla Angela
Home Financials for this Owner
Home Financials are based on the most recent Mortgage that was taken out on this home.
Original Mortgage
$245,000
Interest Rate
4.13%
Mortgage Type
New Conventional
Purchase Details
Closed on
Apr 28, 2008
Sold by
Bowker Jeffery J and Bowker Margaret G
Bought by
Makkyla James L and Makkyla Angela
Home Financials for this Owner
Home Financials are based on the most recent Mortgage that was taken out on this home.
Original Mortgage
$250,400
Interest Rate
5.84%
Mortgage Type
New Conventional
Create a Home Valuation Report for This Property
The Home Valuation Report is an in-depth analysis detailing your home's value as well as a comparison with similar homes in the area
Home Values in the Area
Average Home Value in this Area
Purchase History
| Date | Buyer | Sale Price | Title Company |
|---|---|---|---|
| Hendershot Todd R | -- | None Available | |
| Hendershot Angela M | -- | None Available | |
| Makkyla Angela | -- | Platinum Title Llc | |
| Makkyla James L | -- | Platinum Title Llc |
Source: Public Records
Mortgage History
| Date | Status | Borrower | Loan Amount |
|---|---|---|---|
| Previous Owner | Makkyla Angela | $245,000 | |
| Previous Owner | Makkyla James L | $250,400 |
Source: Public Records
Tax History
| Year | Tax Paid | Tax Assessment Tax Assessment Total Assessment is a certain percentage of the fair market value that is determined by local assessors to be the total taxable value of land and additions on the property. | Land | Improvement |
|---|---|---|---|---|
| 2025 | $5,990 | $58,466 | $12,005 | $46,461 |
| 2024 | $5,990 | $56,224 | $12,005 | $44,219 |
| 2023 | $5,732 | $53,372 | $10,002 | $43,370 |
| 2022 | $5,302 | $49,209 | $10,002 | $39,207 |
| 2021 | $5,211 | $45,540 | $8,699 | $36,841 |
| 2020 | $4,987 | $43,010 | $8,699 | $34,311 |
| 2019 | $4,757 | $40,998 | $7,940 | $33,058 |
| 2018 | $4,456 | $40,250 | $7,940 | $32,310 |
| 2017 | $4,559 | $38,536 | $6,887 | $31,649 |
| 2016 | $4,536 | $37,858 | $6,601 | $31,257 |
| 2015 | $4,225 | $36,455 | $6,601 | $29,854 |
| 2013 | -- | $34,684 | $6,601 | $28,083 |
Source: Public Records
Map
Nearby Homes
- 5537 Alden St
- 5450 Lackman Rd
- 5819 Charlotte St
- 14419 W 51st St
- 5703 Cottonwood St
- 5735 Cottonwood St
- 13821 W 58th Terrace Unit 1
- 13825 W 58th Terrace Unit 6
- 5828 Park Cir
- 5917 Greenwood Dr
- 13505 W 53rd Terrace
- 125 Lakeshore Dr S
- 6123 Acuff St
- 580 Lakeshore Dr W
- 13325 W 49th Terrace
- 6145 Park St
- 6201 Hallet St
- 14208 W 63rd St
- 5021 Bradshaw St
- 450 Hillcrest Rd E
- 5433 Oakview St
- 5441 Oakview St
- 5429 Oakview St
- 5432 Oakview St
- 5440 Oakview St
- 5425 Oakview St
- 5428 Oakview St
- 14300 W 55th St
- 5501 Oakview St
- 5424 Oakview St
- 14310 W 55th St
- 5421 Oakview St
- 5433 Alden St
- 5502 Oakview St
- 5437 Alden St
- 5429 Alden St
- 5420 Oakview St
- 5416 Oakview St
- 5505 Oakview St
- 5506 Oakview St
Your Personal Tour Guide
Ask me questions while you tour the home.