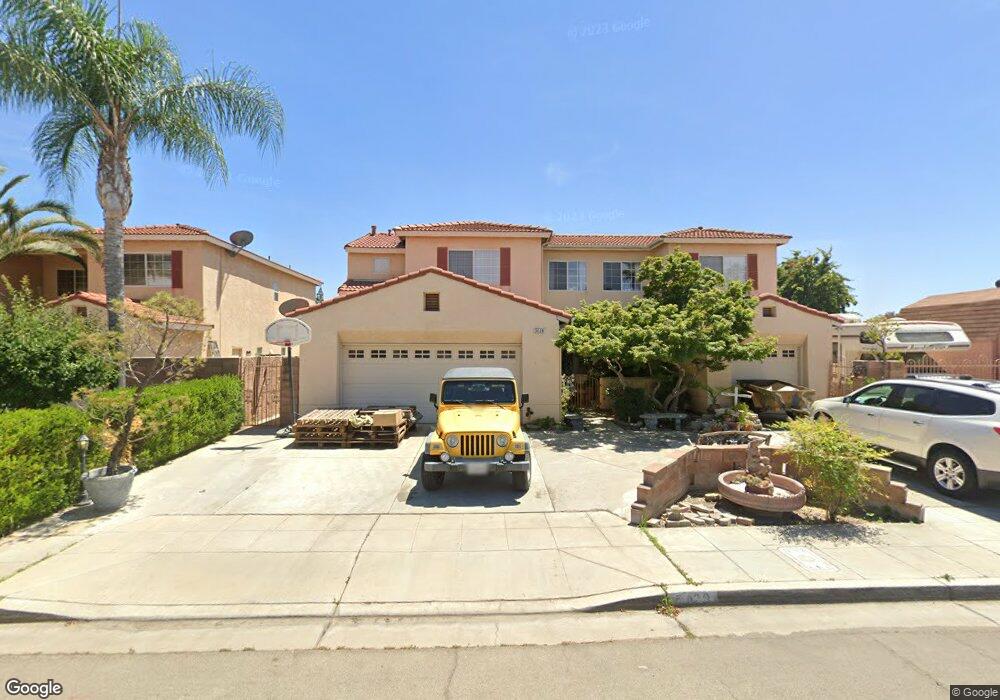
5439 W Lansing Way Fresno, CA 93722
West Fresno NeighborhoodEstimated Value: $462,000 - $524,000
4
Beds
4
Baths
2,600
Sq Ft
$192/Sq Ft
Est. Value
About This Home
This home is located at 5439 W Lansing Way, Fresno, CA 93722 and is currently estimated at $498,798, approximately $191 per square foot. 5439 W Lansing Way is a home located in Fresno County with nearby schools including Harvest Elementary School and Glacier Point Middle School.
Ownership History
Date
Name
Owned For
Owner Type
Purchase Details
Closed on
Dec 16, 1997
Sold by
Prevost Christian M
Bought by
Prevost Christian M and Prevost Gwendolyn Lois
Current Estimated Value
Home Financials for this Owner
Home Financials are based on the most recent Mortgage that was taken out on this home.
Original Mortgage
$149,150
Outstanding Balance
$25,233
Interest Rate
7.23%
Estimated Equity
$473,565
Purchase Details
Closed on
Dec 12, 1997
Sold by
Butler Rocca I
Bought by
Prevost Christian M
Home Financials for this Owner
Home Financials are based on the most recent Mortgage that was taken out on this home.
Original Mortgage
$149,150
Outstanding Balance
$25,233
Interest Rate
7.23%
Estimated Equity
$473,565
Purchase Details
Closed on
Nov 3, 1997
Sold by
Prevost Gwendolyn Lois
Bought by
Prevost Christian M
Home Financials for this Owner
Home Financials are based on the most recent Mortgage that was taken out on this home.
Original Mortgage
$149,150
Outstanding Balance
$25,233
Interest Rate
7.23%
Estimated Equity
$473,565
Create a Home Valuation Report for This Property
The Home Valuation Report is an in-depth analysis detailing your home's value as well as a comparison with similar homes in the area
Home Values in the Area
Average Home Value in this Area
Purchase History
| Date | Buyer | Sale Price | Title Company |
|---|---|---|---|
| Prevost Christian M | -- | Central Title Company | |
| Prevost Christian M | $157,500 | Central Title Company | |
| Prevost Christian M | -- | Central Title Company | |
| Prevost Christian M | -- | Chicago Title Co |
Source: Public Records
Mortgage History
| Date | Status | Borrower | Loan Amount |
|---|---|---|---|
| Open | Prevost Christian M | $149,150 |
Source: Public Records
Tax History Compared to Growth
Tax History
| Year | Tax Paid | Tax Assessment Tax Assessment Total Assessment is a certain percentage of the fair market value that is determined by local assessors to be the total taxable value of land and additions on the property. | Land | Improvement |
|---|---|---|---|---|
| 2025 | $3,107 | $250,658 | $47,884 | $202,774 |
| 2023 | $3,031 | $240,927 | $46,026 | $194,901 |
| 2022 | $2,860 | $236,204 | $45,124 | $191,080 |
| 2021 | $2,880 | $231,574 | $44,240 | $187,334 |
| 2020 | $2,740 | $229,201 | $43,787 | $185,414 |
| 2019 | $2,697 | $224,708 | $42,929 | $181,779 |
| 2018 | $2,634 | $220,303 | $42,088 | $178,215 |
| 2017 | $2,642 | $215,984 | $41,263 | $174,721 |
| 2016 | $2,435 | $211,750 | $40,454 | $171,296 |
| 2015 | $2,423 | $208,570 | $39,847 | $168,723 |
| 2014 | $2,422 | $204,485 | $39,067 | $165,418 |
Source: Public Records
Map
Nearby Homes
- 5443 W Flint Way
- 3340 N Dante Ave
- 3329 N Gregory Ave
- 5871 W Fedora Ave
- 4147 N Barcus Ave
- 6256 Ramona Way
- 3427 Reed Ave
- 3478 Olinda Ave
- 6264 Ramona Way
- 6288 W Ramona Way
- 3379 Reed Ave
- 3402 N Cresta Ave
- 3407 Ensanada Ave
- 5769 W Austin Way
- 4188 N Constance Ave
- 4215 N Barcus Ave
- 4724 W Ashlan Ave
- 5044 W Willis Ave
- Barcelona Plan at Fanucchi Ranch - Valencia Series
- Kallos Plan at Fanucchi Ranch - Calligraphy Series
- 5425 W Lansing Way
- 5411 W Lansing Way
- 3543 N Ellendale Ave
- 5440 W Lansing Way
- 3555 N Ellendale Ave
- 5428 W Lansing Way
- 5416 W Lansing Way
- 3567 N Ellendale Ave
- 5397 W Lansing Way
- 5404 W Lansing Way
- 3579 N Ellendale Ave
- 5383 W Lansing Way
- 5392 W Lansing Way
- 5419 W Flint Way
- 5406 W Dakota Ave
- 3591 N Ellendale Ave
- 5407 W Flint Way
- 5380 W Lansing Way
- 5371 W Lansing Way
- 5395 W Flint Way