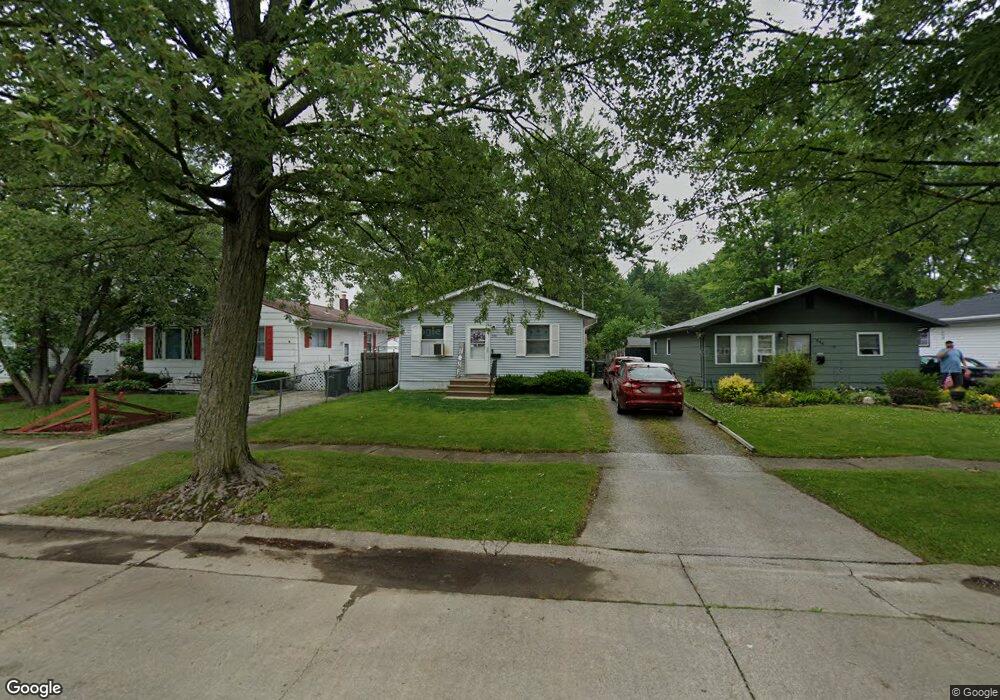
544 Baldwin St Elyria, OH 44035
Estimated Value: $139,049 - $155,000
3
Beds
1
Bath
925
Sq Ft
$161/Sq Ft
Est. Value
About This Home
This home is located at 544 Baldwin St, Elyria, OH 44035 and is currently estimated at $148,762, approximately $160 per square foot. 544 Baldwin St is a home located in Lorain County with nearby schools including Eastern Heights Middle School, Elyria High School, and Constellation Schools: Elyria Community Elementary.
Ownership History
Date
Name
Owned For
Owner Type
Purchase Details
Closed on
Aug 20, 2018
Sold by
Print Megan E
Bought by
Schmitz Patrick J and Schmitz Joyce
Current Estimated Value
Home Financials for this Owner
Home Financials are based on the most recent Mortgage that was taken out on this home.
Original Mortgage
$73,641
Outstanding Balance
$65,287
Interest Rate
5.5%
Mortgage Type
FHA
Estimated Equity
$83,475
Purchase Details
Closed on
Jan 22, 2018
Sold by
Miller Kenneth A and Miller Lynne M
Bought by
Print Megan E
Home Financials for this Owner
Home Financials are based on the most recent Mortgage that was taken out on this home.
Original Mortgage
$67,750
Interest Rate
4.12%
Mortgage Type
FHA
Purchase Details
Closed on
Sep 24, 1997
Sold by
Chemical Bank Trst
Bought by
Miller Kenneth A and Miller Lynne M
Home Financials for this Owner
Home Financials are based on the most recent Mortgage that was taken out on this home.
Original Mortgage
$40,150
Interest Rate
7.63%
Mortgage Type
New Conventional
Create a Home Valuation Report for This Property
The Home Valuation Report is an in-depth analysis detailing your home's value as well as a comparison with similar homes in the area
Home Values in the Area
Average Home Value in this Area
Purchase History
| Date | Buyer | Sale Price | Title Company |
|---|---|---|---|
| Schmitz Patrick J | $75,000 | None Available | |
| Print Megan E | $69,000 | -- | |
| Miller Kenneth A | $45,000 | -- |
Source: Public Records
Mortgage History
| Date | Status | Borrower | Loan Amount |
|---|---|---|---|
| Open | Schmitz Patrick J | $73,641 | |
| Previous Owner | Print Megan E | $67,750 | |
| Previous Owner | Miller Kenneth A | $40,150 |
Source: Public Records
Tax History
| Year | Tax Paid | Tax Assessment Tax Assessment Total Assessment is a certain percentage of the fair market value that is determined by local assessors to be the total taxable value of land and additions on the property. | Land | Improvement |
|---|---|---|---|---|
| 2024 | $1,725 | $35,756 | $7,196 | $28,560 |
| 2023 | $1,511 | $27,573 | $5,814 | $21,760 |
| 2022 | $1,505 | $27,573 | $5,814 | $21,760 |
| 2021 | $1,501 | $27,573 | $5,814 | $21,760 |
| 2020 | $1,321 | $21,580 | $4,550 | $17,030 |
| 2019 | $1,312 | $21,580 | $4,550 | $17,030 |
| 2018 | $1,368 | $21,580 | $4,550 | $17,030 |
| 2017 | $1,388 | $21,310 | $4,610 | $16,700 |
| 2016 | $1,371 | $21,310 | $4,610 | $16,700 |
| 2015 | $1,286 | $21,310 | $4,610 | $16,700 |
| 2014 | $1,319 | $22,130 | $4,790 | $17,340 |
| 2013 | $1,308 | $22,130 | $4,790 | $17,340 |
Source: Public Records
Map
Nearby Homes
- 523 Purdue Ave
- 1210 Prospect St
- 549 Delaware Ave
- 746 Delaware Ave
- 914 Garford Ave
- 817 Boston Ave
- 337 University Ave
- 832 S Logan St
- 800 Boston Ave
- 247 Georgia Ave
- 148 Bentley Dr Unit 25
- 708 Park Ave
- 154 Bentley Dr
- 340 Boston Ave
- 459 Auburn St
- 310 Carol Ln
- 418 Carol Ln
- 246 Syracuse Ct
- 150 Denison Ave
- 453 Kenyon Ave
- 544 Baldwin Ave
- 540 Baldwin St
- 548 Baldwin Ave
- 548 Baldwin St
- 538 Baldwin St
- 550 Baldwin St
- 554 Baldwin St
- 534 Baldwin Ave
- 545 Purdue Ave
- 534 Baldwin St
- 549 Purdue Ave
- 553 Baldwin Ave
- 537 Purdue Ave
- 558 Baldwin St
- 532 Baldwin St
- 558 Baldwin Ave
- 545 Baldwin St
- 541 Baldwin St
- 560 Baldwin Ave
- 560 Baldwin St
Your Personal Tour Guide
Ask me questions while you tour the home.