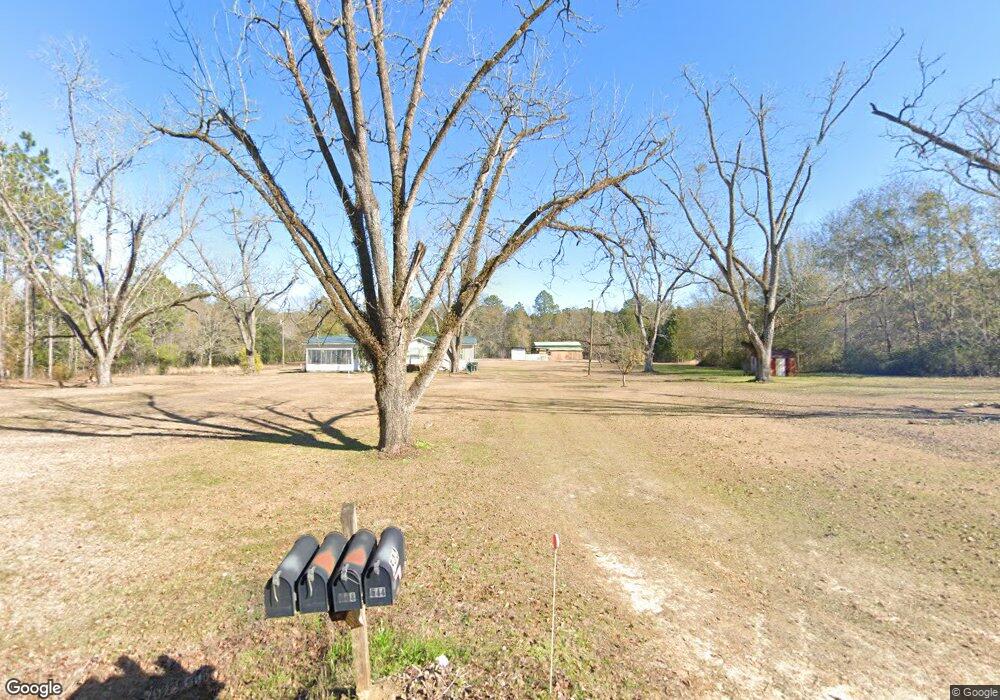
544 Belcher Rd Quitman, GA 31643
Estimated Value: $251,000 - $308,000
3
Beds
2
Baths
1,528
Sq Ft
$181/Sq Ft
Est. Value
About This Home
This home is located at 544 Belcher Rd, Quitman, GA 31643 and is currently estimated at $277,308, approximately $181 per square foot. 544 Belcher Rd is a home located in Brooks County with nearby schools including North Brooks Elementary School.
Ownership History
Date
Name
Owned For
Owner Type
Purchase Details
Closed on
May 7, 2021
Sold by
Giddens Renae L
Bought by
Hamm Jonathan
Current Estimated Value
Home Financials for this Owner
Home Financials are based on the most recent Mortgage that was taken out on this home.
Original Mortgage
$214,051
Outstanding Balance
$193,984
Interest Rate
3.1%
Mortgage Type
FHA
Estimated Equity
$83,324
Purchase Details
Closed on
Mar 25, 2021
Sold by
Dampier Sharon
Bought by
Giddens Renae L
Home Financials for this Owner
Home Financials are based on the most recent Mortgage that was taken out on this home.
Original Mortgage
$214,051
Outstanding Balance
$193,984
Interest Rate
3.1%
Mortgage Type
FHA
Estimated Equity
$83,324
Purchase Details
Closed on
Nov 3, 2009
Sold by
Giddens Renae L
Bought by
Dampier Sharon L and Dampier Emory E
Purchase Details
Closed on
Feb 13, 1990
Bought by
Bush Sharon L and Bergin Renae L
Create a Home Valuation Report for This Property
The Home Valuation Report is an in-depth analysis detailing your home's value as well as a comparison with similar homes in the area
Home Values in the Area
Average Home Value in this Area
Purchase History
| Date | Buyer | Sale Price | Title Company |
|---|---|---|---|
| Hamm Jonathan | $218,000 | -- | |
| Giddens Renae L | -- | -- | |
| Dampier Sharon L | -- | -- | |
| Giddens Renae L | $40,000 | -- | |
| Bush Sharon L | $25,300 | -- |
Source: Public Records
Mortgage History
| Date | Status | Borrower | Loan Amount |
|---|---|---|---|
| Open | Hamm Jonathan | $214,051 |
Source: Public Records
Tax History Compared to Growth
Tax History
| Year | Tax Paid | Tax Assessment Tax Assessment Total Assessment is a certain percentage of the fair market value that is determined by local assessors to be the total taxable value of land and additions on the property. | Land | Improvement |
|---|---|---|---|---|
| 2024 | $1,871 | $58,300 | $43,040 | $15,260 |
| 2023 | $1,720 | $52,347 | $38,440 | $13,907 |
| 2022 | $1,780 | $49,864 | $36,600 | $13,264 |
| 2021 | $1,423 | $41,845 | $29,800 | $12,045 |
| 2020 | $1,173 | $42,244 | $29,800 | $12,444 |
| 2019 | $1,191 | $34,934 | $26,200 | $8,734 |
| 2018 | $994 | $34,051 | $25,240 | $8,811 |
| 2017 | $1,152 | $6,816 | $0 | $6,816 |
| 2016 | $1,189 | $18,702 | $0 | $0 |
| 2015 | -- | $16,564 | $0 | $0 |
| 2014 | -- | $34,776 | $25,240 | $9,536 |
| 2013 | -- | $34,776 | $25,240 | $9,536 |
Source: Public Records
Map
Nearby Homes
- 11439 Adel Hwy
- 85 Hitch St
- 916 Robinson Rd
- 168 Azalea St
- 1440 Peach Rd
- 2275 Old Coffee Rd
- 4386 Studstill Rd
- 237 Turkey Ridge Ln
- Tract 2 Hall Webb Rd
- 51 Green Lake Cir
- 17 Green Lake Cir
- 8311 N Coffee Rd
- 8349 Coffee Rd
- 8290 Morven Rd
- 0 Burton Rd Unit 23760976
- 0 Burton Rd Unit 23669194
- 6211 Hardee Dr
- 6821 Miller Bridge Rd
- 7552 Webb Rd
- 8739 Folsom Rd
- 502 Belcher Rd
- 466 Belcher Rd
- 569 Belcher Rd
- 627 Belcher Rd
- 286 Belcher Rd
- 255 Belcher Rd
- 224 Belcher Rd
- 180 Belcher Rd
- 76 Belcher Rd
- 8593 Coffee Rd
- 1020 Belcher Rd
- 8722 Coffee Rd
- 8334 Coffee Rd
- 8698 Coffee Rd
- 8698 Coffee Rd
- 8842 Coffee Rd
- 6325 Jackson Rd
- 1272 Belcher Rd
- 2266 Duckworth Rd
- 6464 Jackson Rd