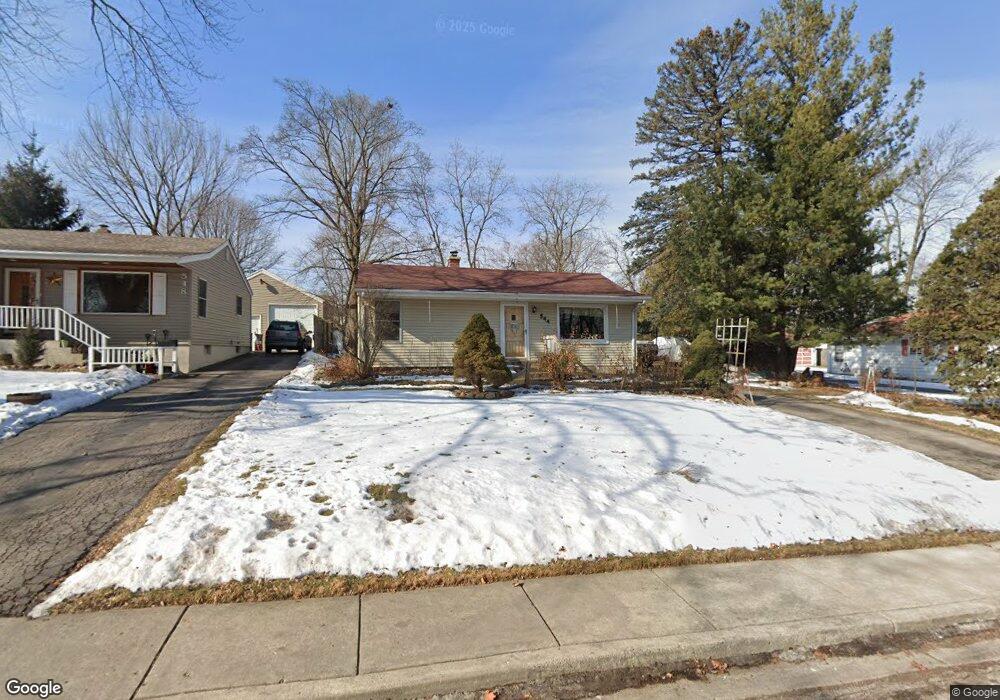
544 Harrison St Elgin, IL 60120
Southeast Elgin NeighborhoodEstimated Value: $265,000 - $284,000
2
Beds
1
Bath
1,115
Sq Ft
$244/Sq Ft
Est. Value
About This Home
This home is located at 544 Harrison St, Elgin, IL 60120 and is currently estimated at $271,881, approximately $243 per square foot. 544 Harrison St is a home located in Cook County with nearby schools including Huff Elementary School, Ellis Middle School, and Elgin High School.
Ownership History
Date
Name
Owned For
Owner Type
Purchase Details
Closed on
Aug 15, 1996
Sold by
Meyer Judith Lynn and Johnson Norman D
Bought by
Kidd Tracy L and Blair Gary P
Current Estimated Value
Home Financials for this Owner
Home Financials are based on the most recent Mortgage that was taken out on this home.
Original Mortgage
$84,509
Outstanding Balance
$5,547
Interest Rate
8.3%
Mortgage Type
FHA
Estimated Equity
$266,334
Create a Home Valuation Report for This Property
The Home Valuation Report is an in-depth analysis detailing your home's value as well as a comparison with similar homes in the area
Home Values in the Area
Average Home Value in this Area
Purchase History
| Date | Buyer | Sale Price | Title Company |
|---|---|---|---|
| Kidd Tracy L | $85,000 | -- |
Source: Public Records
Mortgage History
| Date | Status | Borrower | Loan Amount |
|---|---|---|---|
| Open | Kidd Tracy L | $84,509 |
Source: Public Records
Tax History
| Year | Tax Paid | Tax Assessment Tax Assessment Total Assessment is a certain percentage of the fair market value that is determined by local assessors to be the total taxable value of land and additions on the property. | Land | Improvement |
|---|---|---|---|---|
| 2025 | $4,825 | $24,002 | $4,620 | $19,382 |
| 2024 | $4,825 | $19,747 | $2,640 | $17,107 |
| 2023 | $4,663 | $19,747 | $2,640 | $17,107 |
| 2022 | $4,663 | $19,747 | $2,640 | $17,107 |
| 2021 | $3,409 | $12,889 | $1,815 | $11,074 |
| 2020 | $3,457 | $12,889 | $1,815 | $11,074 |
| 2019 | $3,517 | $14,562 | $1,815 | $12,747 |
| 2018 | $3,372 | $13,016 | $1,650 | $11,366 |
| 2017 | $3,380 | $13,016 | $1,650 | $11,366 |
| 2016 | $3,432 | $13,016 | $1,650 | $11,366 |
| 2015 | $3,246 | $11,601 | $1,485 | $10,116 |
| 2014 | $3,161 | $11,601 | $1,485 | $10,116 |
| 2013 | $3,039 | $11,601 | $1,485 | $10,116 |
Source: Public Records
Map
Nearby Homes
- 689 Bent St
- 445 Lucile Ave
- 631 Bent St
- 457 Arlington Ave
- 385 Woodview Cir Unit B
- 450 Villa St
- 518 Raymond St
- 356 Woodview Cir Unit A
- 483 Barrett St
- 262 Bartlett Place
- 1182 Concord Dr
- 286 Villa St
- 277 Gifford Place
- 833 Forest Ave
- 462 Ashland Ave
- 115 N Porter St
- 149 Highbury Dr
- 162 Festival Ct
- 7 National St Unit 7
- 3 National St Unit 3
- 544 Harrison St
- 540 Harrison St
- 548 Harrison St
- 526 Harrison St
- 537 Cleveland Ave
- 533 Cleveland Ave
- 545 Cleveland Ave
- 522 Harrison St
- 541 Harrison St
- 814 May St
- 820 May St
- 527 Cleveland Ave
- 545 Harrison St
- 802 May St
- 521 Cleveland Ave
- 518 Harrison St
- 532 Willard Ave
- 850 May St
- 536 Willard Ave
- 515 Cleveland Ave
Your Personal Tour Guide
Ask me questions while you tour the home.