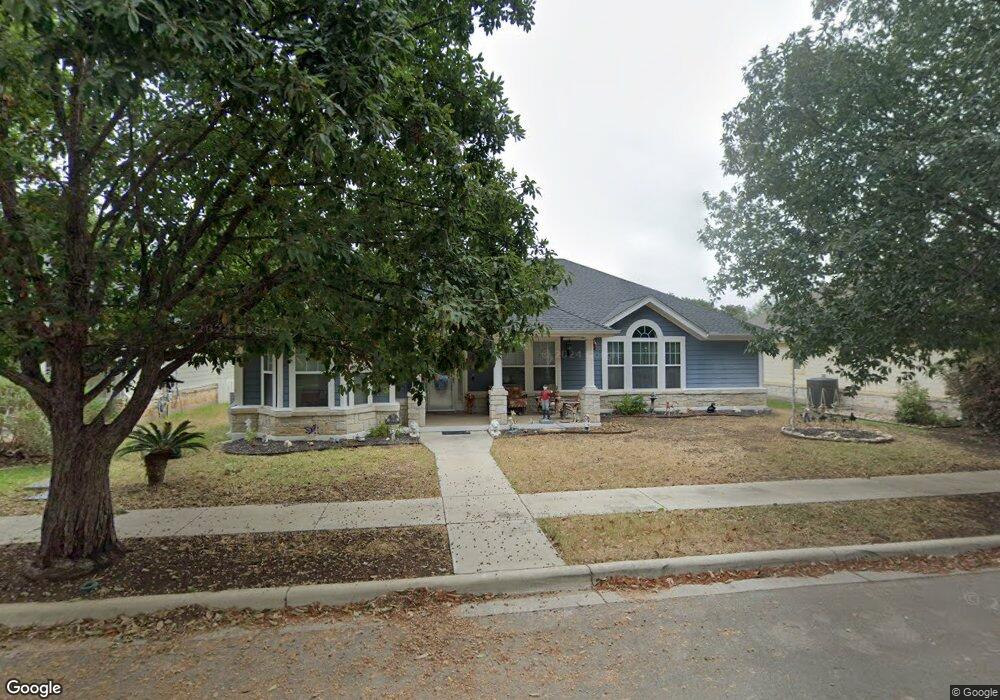
544 Jo Lynn New Braunfels, TX 78130
Gruene NeighborhoodEstimated Value: $438,971 - $489,000
--
Bed
3
Baths
2,180
Sq Ft
$215/Sq Ft
Est. Value
About This Home
This home is located at 544 Jo Lynn, New Braunfels, TX 78130 and is currently estimated at $468,993, approximately $215 per square foot. 544 Jo Lynn is a home located in Comal County with nearby schools including Goodwin Frazier Elementary School, Church Hill Middle School, and Cross Lutheran School.
Ownership History
Date
Name
Owned For
Owner Type
Purchase Details
Closed on
Nov 19, 2024
Sold by
Harpster Mary Lou
Bought by
Harpster Mary Lou and Harpster Robert L
Current Estimated Value
Purchase Details
Closed on
Mar 9, 2006
Sold by
Robert West Builder Inc
Bought by
Harpster Robert L and Harpster Mary Lou
Home Financials for this Owner
Home Financials are based on the most recent Mortgage that was taken out on this home.
Original Mortgage
$70,000
Interest Rate
6.21%
Mortgage Type
New Conventional
Purchase Details
Closed on
Sep 27, 2005
Sold by
West Leach & Associates Inc
Bought by
Robert West Builder Inc
Home Financials for this Owner
Home Financials are based on the most recent Mortgage that was taken out on this home.
Original Mortgage
$163,000
Interest Rate
5.76%
Mortgage Type
Construction
Create a Home Valuation Report for This Property
The Home Valuation Report is an in-depth analysis detailing your home's value as well as a comparison with similar homes in the area
Home Values in the Area
Average Home Value in this Area
Purchase History
| Date | Buyer | Sale Price | Title Company |
|---|---|---|---|
| Harpster Mary Lou | -- | None Listed On Document | |
| Harpster Mary Lou | -- | None Listed On Document | |
| Harpster Robert L | -- | New Braunfels Title Co | |
| Robert West Builder Inc | -- | New Braunfels Title Co |
Source: Public Records
Mortgage History
| Date | Status | Borrower | Loan Amount |
|---|---|---|---|
| Previous Owner | Harpster Robert L | $70,000 | |
| Previous Owner | Robert West Builder Inc | $163,000 |
Source: Public Records
Tax History Compared to Growth
Tax History
| Year | Tax Paid | Tax Assessment Tax Assessment Total Assessment is a certain percentage of the fair market value that is determined by local assessors to be the total taxable value of land and additions on the property. | Land | Improvement |
|---|---|---|---|---|
| 2025 | $1,148 | $464,486 | -- | -- |
| 2024 | $1,148 | $422,260 | -- | -- |
| 2023 | $1,148 | $383,873 | $0 | $0 |
| 2022 | $2,795 | $348,975 | -- | -- |
| 2021 | $6,717 | $317,250 | $69,760 | $247,490 |
| 2020 | $6,796 | $310,850 | $69,760 | $241,090 |
| 2019 | $6,976 | $311,950 | $53,670 | $258,280 |
| 2018 | $6,439 | $287,960 | $53,670 | $234,290 |
| 2017 | $6,248 | $280,020 | $30,000 | $250,020 |
| 2016 | $5,900 | $264,420 | $30,000 | $234,420 |
| 2015 | $2,929 | $253,240 | $30,000 | $223,240 |
| 2014 | $2,929 | $241,790 | $30,000 | $211,790 |
Source: Public Records
Map
Nearby Homes
- 546 Melissa Ln
- 1516 Denise Dr
- 581 Kellys Way
- 569 Kellys Way
- 1412 Denise Dr
- 1545 Pams Path
- 1330 Fieldcrest
- 1334 Carnation Ln
- 1458 Janets Way
- 328 Harvest Fields
- 451 Butterfly Bush Ct
- 329 Butterfly Rose Dr
- 327 Elephants Ear Dr
- 342 N Kowald Ln
- 1618 Cotton Crossing Ln
- 1382 Hanz Dr
- 2223 Gruene Lake Dr
- 1267 E Common St
- 1659 Hanz Dr
- 616 Ridgecrest