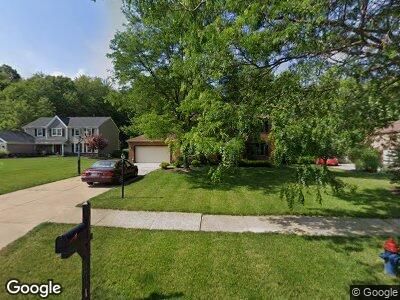
544 Quail Run Dr Broadview Heights, OH 44147
Estimated Value: $447,000 - $596,000
4
Beds
3
Baths
2,500
Sq Ft
$216/Sq Ft
Est. Value
About This Home
This home is located at 544 Quail Run Dr, Broadview Heights, OH 44147 and is currently estimated at $538,869, approximately $215 per square foot. 544 Quail Run Dr is a home located in Cuyahoga County with nearby schools including Brecksville-Broadview Heights Middle School, Brecksville-Broadview Heights High School, and Assumption Academy.
Ownership History
Date
Name
Owned For
Owner Type
Purchase Details
Closed on
Jan 4, 2011
Sold by
Meinhardt Howard J and Meinhardt Kathleen R
Bought by
Putnam Craig D and Putnam Laura A
Current Estimated Value
Home Financials for this Owner
Home Financials are based on the most recent Mortgage that was taken out on this home.
Original Mortgage
$275,000
Interest Rate
4.5%
Mortgage Type
VA
Purchase Details
Closed on
Jun 26, 1995
Sold by
Caponero Richard M
Bought by
Meinhardt Howard J and Meinhardt Kathleen R
Home Financials for this Owner
Home Financials are based on the most recent Mortgage that was taken out on this home.
Original Mortgage
$50,000
Interest Rate
6.5%
Mortgage Type
New Conventional
Purchase Details
Closed on
Sep 29, 1989
Bought by
Caponero Richard M
Purchase Details
Closed on
Dec 23, 1987
Bought by
Wm Bailey Construction
Purchase Details
Closed on
Jan 1, 1986
Bought by
Park Realty Co
Create a Home Valuation Report for This Property
The Home Valuation Report is an in-depth analysis detailing your home's value as well as a comparison with similar homes in the area
Home Values in the Area
Average Home Value in this Area
Purchase History
| Date | Buyer | Sale Price | Title Company |
|---|---|---|---|
| Putnam Craig D | $275,000 | Barristers Title Agency | |
| Meinhardt Howard J | $232,000 | -- | |
| Caponero Richard M | $171,000 | -- | |
| Wm Bailey Construction | -- | -- | |
| Park Realty Co | -- | -- |
Source: Public Records
Mortgage History
| Date | Status | Borrower | Loan Amount |
|---|---|---|---|
| Open | Putnam Laura A | $186,400 | |
| Closed | Putman Craig D | $277,000 | |
| Closed | Putnam Craig D | $275,000 | |
| Previous Owner | Meinhardt Howard J | $50,000 |
Source: Public Records
Tax History Compared to Growth
Tax History
| Year | Tax Paid | Tax Assessment Tax Assessment Total Assessment is a certain percentage of the fair market value that is determined by local assessors to be the total taxable value of land and additions on the property. | Land | Improvement |
|---|---|---|---|---|
| 2024 | $8,428 | $154,630 | $25,585 | $129,045 |
| 2023 | $8,300 | $128,840 | $23,910 | $104,930 |
| 2022 | $8,252 | $128,840 | $23,910 | $104,930 |
| 2021 | $8,176 | $128,840 | $23,910 | $104,930 |
| 2020 | $8,013 | $114,000 | $21,140 | $92,860 |
| 2019 | $7,739 | $325,700 | $60,400 | $265,300 |
| 2018 | $7,197 | $114,000 | $21,140 | $92,860 |
| 2017 | $7,763 | $108,400 | $17,990 | $90,410 |
| 2016 | $6,990 | $103,010 | $17,990 | $85,020 |
| 2015 | $6,250 | $103,010 | $17,990 | $85,020 |
| 2014 | $6,250 | $96,250 | $16,800 | $79,450 |
Source: Public Records
Map
Nearby Homes
- 519 Quail Run Dr
- 8595 Scenicview Dr Unit S205
- 2376 W Wallings Rd
- 696 Tollis Pkwy Unit A
- 8473 Camden Ct
- 2637 W Wallings Rd
- 8329 Windsor Way
- 600 Tollis Pkwy Unit 209
- 8663 Scenicview Dr
- 753 Tollis Pkwy Unit 14-08
- 129 Kimrose Ln
- 721 Tollis Pkwy Unit 68
- 947 Tollis Pkwy Unit 28
- 625 Tollis Pkwy
- 521 Tollis Pkwy Unit 396
- 453 Bordeaux Blvd
- 469 Bordeaux Blvd
- 8211 Twin Oaks Dr
- 2901 Crystalwood Dr
- 2821 Amelia Dr
- 544 Quail Run Dr
- 532 Quail Run Dr
- 556 Quail Run Dr
- 520 Quail Run Dr
- 568 Quail Run Dr
- 555 Quail Run Dr
- 8442 Lido Dr
- 543 Quail Run Dr
- 567 Quail Run Dr
- 508 Quail Run Dr
- 531 Quail Run Dr
- 8430 Lido Dr
- 580 Quail Run Dr
- 591 Quail Run Dr
- 507 Quail Run Dr
- 8418 Lido Dr
- 484 Quail Run Dr
- 376 Village Dr
- 370 Village Dr
- 495 Quail Run Dr