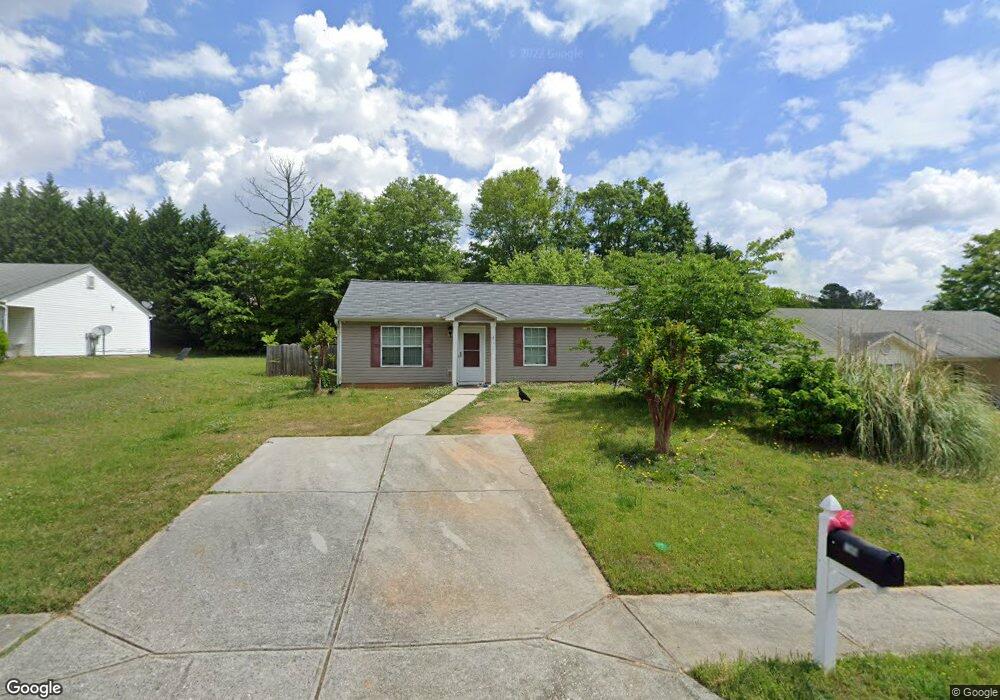
544 Scrooch Ct Winder, GA 30680
Estimated Value: $242,000 - $277,000
3
Beds
2
Baths
1,188
Sq Ft
$224/Sq Ft
Est. Value
About This Home
This home is located at 544 Scrooch Ct, Winder, GA 30680 and is currently estimated at $266,108, approximately $223 per square foot. 544 Scrooch Ct is a home located in Barrow County with nearby schools including Holsenbeck Elementary School, Bear Creek Middle School, and Winder-Barrow High School.
Ownership History
Date
Name
Owned For
Owner Type
Purchase Details
Closed on
Mar 16, 2021
Sold by
Alverez Jorge L
Bought by
Alvarez Jorman Marquez
Current Estimated Value
Purchase Details
Closed on
Sep 30, 2011
Sold by
Harp Properties Llc
Bought by
Alvarez Jorge L
Purchase Details
Closed on
Jan 26, 2011
Sold by
Hsbc Mtg Svcs Inc
Bought by
Harp Properties
Purchase Details
Closed on
Aug 3, 2010
Sold by
Barrett Amanda L
Bought by
Hsbc Mtg Svcs Inc
Purchase Details
Closed on
Jul 23, 2004
Sold by
Tmh Hms Llc
Bought by
Barrett Amanda L
Home Financials for this Owner
Home Financials are based on the most recent Mortgage that was taken out on this home.
Original Mortgage
$71,900
Interest Rate
6.24%
Mortgage Type
New Conventional
Purchase Details
Closed on
Jan 20, 2004
Sold by
Hoover James P And
Bought by
Tmh Homes Llc
Purchase Details
Closed on
Mar 5, 2002
Bought by
Hoover James P And
Create a Home Valuation Report for This Property
The Home Valuation Report is an in-depth analysis detailing your home's value as well as a comparison with similar homes in the area
Home Values in the Area
Average Home Value in this Area
Purchase History
| Date | Buyer | Sale Price | Title Company |
|---|---|---|---|
| Alvarez Jorman Marquez | -- | -- | |
| Alvarez Jorge L | $42,000 | -- | |
| Harp Properties | $37,000 | -- | |
| Hsbc Mtg Svcs Inc | $47,455 | -- | |
| Hsbc Mortgage Services Inc | $47,500 | -- | |
| Barrett Amanda L | $89,900 | -- | |
| Tmh Homes Llc | $32,000 | -- | |
| Hoover James P And | -- | -- |
Source: Public Records
Mortgage History
| Date | Status | Borrower | Loan Amount |
|---|---|---|---|
| Previous Owner | Barrett Amanda L | $71,900 |
Source: Public Records
Tax History Compared to Growth
Tax History
| Year | Tax Paid | Tax Assessment Tax Assessment Total Assessment is a certain percentage of the fair market value that is determined by local assessors to be the total taxable value of land and additions on the property. | Land | Improvement |
|---|---|---|---|---|
| 2024 | $2,182 | $76,920 | $16,800 | $60,120 |
| 2023 | $2,176 | $76,920 | $16,800 | $60,120 |
| 2022 | $2,030 | $62,914 | $14,400 | $48,514 |
| 2021 | $1,992 | $60,107 | $12,800 | $47,307 |
| 2020 | $1,508 | $46,445 | $10,000 | $36,445 |
| 2019 | $1,527 | $46,445 | $10,000 | $36,445 |
| 2018 | $1,003 | $30,777 | $6,400 | $24,377 |
| 2017 | $789 | $26,434 | $6,400 | $20,034 |
| 2016 | $778 | $26,656 | $6,400 | $20,256 |
| 2015 | $787 | $26,878 | $6,400 | $20,478 |
| 2014 | $883 | $25,025 | $6,370 | $18,655 |
| 2013 | -- | $26,052 | $6,370 | $19,682 |
Source: Public Records
Map
Nearby Homes
- 163 Wood Cir
- 205 Glenview Terrace
- 200 Capitol Ave
- 194 Graham St
- 120 N Williamson St
- 227 Martin Luther King jr Dr
- 165 Shields St
- 122 Capitol Ave
- 209 Georgia Ave
- 270 Griffith St
- 19 Holland Cove
- 25 Holland Cove
- 55 Huckleberry Ln
- 206 Atlas Ln
- 193 Atlas Ln
- 218 Atlas Ln
- 153 Atlas Ln
- 181 Atlas Ln
- 211 Atlas Ln
- 546 Scrooch Ct
- 542 Scrooch Ct
- 405 Harpy Eagle Dr
- 403 Harpy Eagle Dr
- 407 Harpy Eagle Dr Unit 9
- 407 Harpy Eagle Dr
- 548 Scrooch Ct
- 540 Scrooch Ct
- 543 Scrooch Ct
- 545 Scrooch Ct
- 0 Scrooch Ct Unit 8485826
- 0 Scrooch Ct Unit 8913165
- 0 Scrooch Ct Unit 8926749
- 0 Scrooch Ct
- 409 Harpy Eagle Dr
- 401 Harpy Eagle Dr
- 547 Scrooch Ct
- 547 Scrooch Ct Unit 19
- 541 Scrooch Ct Unit 16
- 541 Scrooch Ct