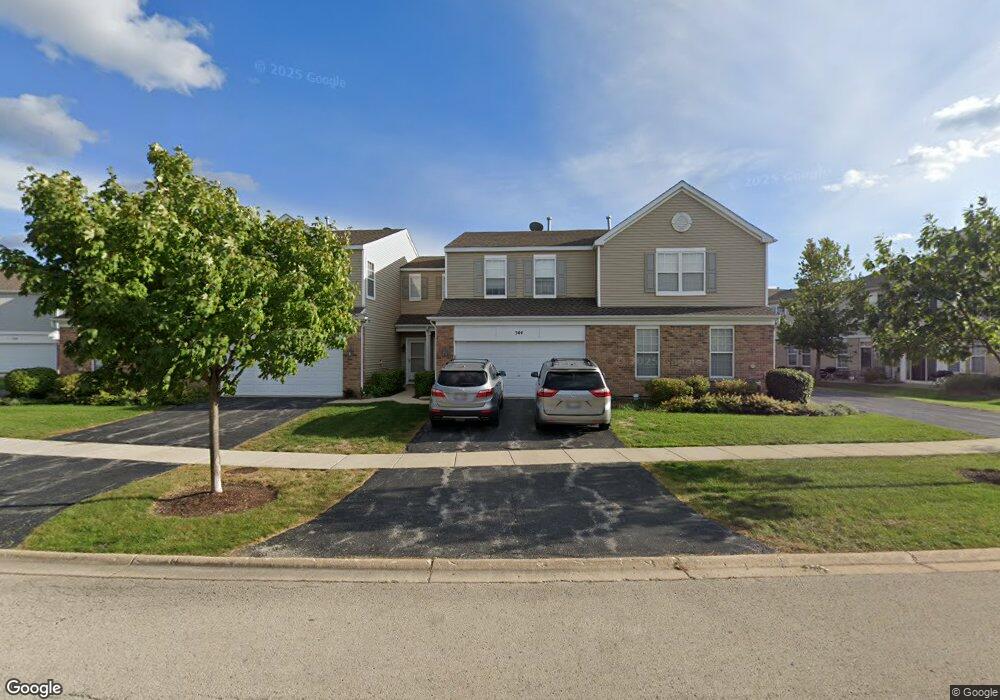
544 Springbrook Trail N Unit 1 Oswego, IL 60543
North Oswego NeighborhoodEstimated Value: $262,000 - $285,000
3
Beds
2
Baths
1,510
Sq Ft
$181/Sq Ft
Est. Value
About This Home
This home is located at 544 Springbrook Trail N Unit 1, Oswego, IL 60543 and is currently estimated at $273,012, approximately $180 per square foot. 544 Springbrook Trail N Unit 1 is a home located in Kendall County with nearby schools including Long Beach Elementary School, Plank Junior High School, and Oswego East High School.
Ownership History
Date
Name
Owned For
Owner Type
Purchase Details
Closed on
Jul 7, 2020
Sold by
Challenge Investment Group Llc Series C
Bought by
Solis Ana E
Current Estimated Value
Home Financials for this Owner
Home Financials are based on the most recent Mortgage that was taken out on this home.
Original Mortgage
$171,830
Outstanding Balance
$153,481
Interest Rate
3.5%
Mortgage Type
FHA
Estimated Equity
$119,531
Purchase Details
Closed on
Oct 2, 2013
Sold by
Challenge Investment Group Llc
Bought by
Challenge Investment Group Llc Series C
Purchase Details
Closed on
Nov 19, 2007
Sold by
Allred Daniel C and Allred Autumn L
Bought by
Challenge Investment Group Llc
Purchase Details
Closed on
Mar 1, 2004
Sold by
Centex Homes
Bought by
Allred Daniel C and Putmore Autumn L
Home Financials for this Owner
Home Financials are based on the most recent Mortgage that was taken out on this home.
Original Mortgage
$156,846
Interest Rate
5.65%
Mortgage Type
FHA
Create a Home Valuation Report for This Property
The Home Valuation Report is an in-depth analysis detailing your home's value as well as a comparison with similar homes in the area
Home Values in the Area
Average Home Value in this Area
Purchase History
| Date | Buyer | Sale Price | Title Company |
|---|---|---|---|
| Solis Ana E | $175,000 | Fidelity National Title | |
| Challenge Investment Group Llc Series C | -- | None Available | |
| Challenge Investment Group Llc | $175,000 | None Available | |
| Allred Daniel C | $159,500 | Chicago Title Insurance Co |
Source: Public Records
Mortgage History
| Date | Status | Borrower | Loan Amount |
|---|---|---|---|
| Open | Solis Ana E | $171,830 | |
| Previous Owner | Allred Daniel C | $156,846 |
Source: Public Records
Tax History
| Year | Tax Paid | Tax Assessment Tax Assessment Total Assessment is a certain percentage of the fair market value that is determined by local assessors to be the total taxable value of land and additions on the property. | Land | Improvement |
|---|---|---|---|---|
| 2024 | $5,574 | $75,270 | $12,992 | $62,278 |
| 2023 | $4,982 | $65,452 | $11,297 | $54,155 |
| 2022 | $4,982 | $61,170 | $10,558 | $50,612 |
| 2021 | $4,788 | $57,168 | $9,867 | $47,301 |
| 2020 | $5,244 | $55,503 | $9,580 | $45,923 |
| 2019 | $5,158 | $53,737 | $9,580 | $44,157 |
| 2018 | $4,452 | $45,796 | $8,164 | $37,632 |
| 2017 | $4,327 | $42,208 | $7,524 | $34,684 |
| 2016 | $3,991 | $38,371 | $6,840 | $31,531 |
| 2015 | $3,737 | $34,260 | $6,107 | $28,153 |
| 2014 | -- | $32,320 | $5,761 | $26,559 |
| 2013 | -- | $35,130 | $6,262 | $28,868 |
Source: Public Records
Map
Nearby Homes
- 303 Springbrook Trail S Unit 1
- 309 Springbrook Trail S
- 410 Manchester Rd
- 502 Vernon Dr
- 0000 Fifth St
- 2071 Wiesbrook Dr
- 313 Kensington Dr
- 207 Long Beach Rd
- 623 Queen Dr
- 209 Huntington Ct
- 307 Huntington Ct
- 34 Sonora Dr
- 786 Bohannon Cir
- 225 Mondovi Dr
- 790 Bohannon Cir
- 162 Heathgate Rd
- 122 Longbeach Rd
- 121 Preakness Dr
- 1855 Grandview Place Unit 2B
- 810 Georgetown Dr
- 544 Springbrook Trail N
- 542 Springbrook Trail N
- 546 Springbrook Trail N
- 546 Springbrook Trail N Unit N
- 540 Springbrook Trail N Unit 1
- 470 Brookside Dr
- 468 Brookside Dr
- 526 Springbrook Trail N Unit 1
- 474 Brookside Dr Unit 1
- 474 Brookside Dr Unit 474
- 476 Brookside Dr
- 551 Springbrook Trail N Unit 1
- 549 Springbrook Trail N
- 553 Springbrook Trail N Unit 1
- 547 Springbrook Trail N
- 555 Springbrook Trail N Unit 1
- 555 Springbrook Trail N Unit 555
- 545 Springbrook Trail N
- 543 Springbrook Trail N Unit 1
Your Personal Tour Guide
Ask me questions while you tour the home.