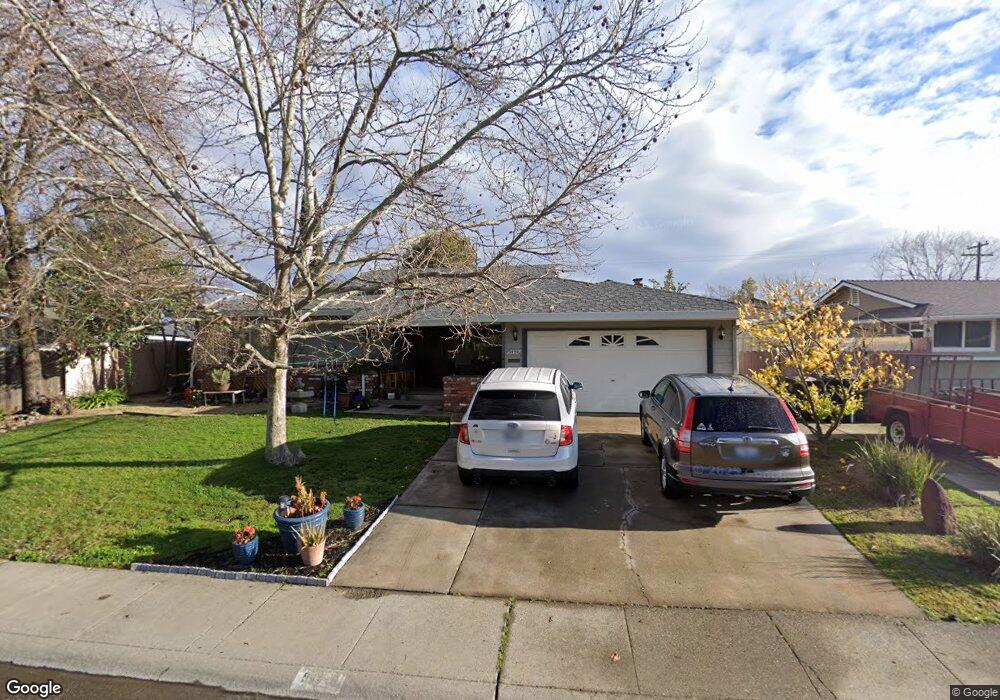
5440 Bartig Way Citrus Heights, CA 95621
Estimated Value: $380,000 - $485,000
3
Beds
2
Baths
1,300
Sq Ft
$343/Sq Ft
Est. Value
About This Home
This home is located at 5440 Bartig Way, Citrus Heights, CA 95621 and is currently estimated at $445,304, approximately $342 per square foot. 5440 Bartig Way is a home located in Sacramento County with nearby schools including Charles Peck Elementary School, Will Rogers Middle School, and San Juan High School.
Ownership History
Date
Name
Owned For
Owner Type
Purchase Details
Closed on
Feb 22, 2015
Sold by
Krevi Norman T and Krevi Debbie A
Bought by
The Norman & Deborah K Revi Living Trust
Current Estimated Value
Home Financials for this Owner
Home Financials are based on the most recent Mortgage that was taken out on this home.
Original Mortgage
$155,000
Outstanding Balance
$54,595
Interest Rate
3.6%
Mortgage Type
New Conventional
Estimated Equity
$390,709
Purchase Details
Closed on
Aug 20, 2014
Sold by
Krevi Norman and Krevi Deborah
Bought by
Krevi Norman T and Krevi Deborah A
Purchase Details
Closed on
Jun 24, 1994
Sold by
King Patricia L
Bought by
Krevi Norman and Krevi Debbie
Home Financials for this Owner
Home Financials are based on the most recent Mortgage that was taken out on this home.
Original Mortgage
$32,500
Interest Rate
8.53%
Create a Home Valuation Report for This Property
The Home Valuation Report is an in-depth analysis detailing your home's value as well as a comparison with similar homes in the area
Home Values in the Area
Average Home Value in this Area
Purchase History
| Date | Buyer | Sale Price | Title Company |
|---|---|---|---|
| The Norman & Deborah K Revi Living Trust | -- | First American Title Company | |
| Krevi Norman T | -- | First American Title Company | |
| Krevi Norman T | -- | None Available | |
| Krevi Norman | $120,000 | Fidelity National Title |
Source: Public Records
Mortgage History
| Date | Status | Borrower | Loan Amount |
|---|---|---|---|
| Open | Krevi Norman T | $155,000 | |
| Closed | Krevi Norman | $32,500 | |
| Closed | Krevi Norman | $75,000 |
Source: Public Records
Tax History Compared to Growth
Tax History
| Year | Tax Paid | Tax Assessment Tax Assessment Total Assessment is a certain percentage of the fair market value that is determined by local assessors to be the total taxable value of land and additions on the property. | Land | Improvement |
|---|---|---|---|---|
| 2025 | $2,980 | $259,466 | $67,170 | $192,296 |
| 2024 | $2,980 | $254,379 | $65,853 | $188,526 |
| 2023 | $2,903 | $249,392 | $64,562 | $184,830 |
| 2022 | $2,886 | $244,503 | $63,297 | $181,206 |
| 2021 | $2,837 | $239,709 | $62,056 | $177,653 |
| 2020 | $2,783 | $237,252 | $61,420 | $175,832 |
| 2019 | $2,725 | $232,601 | $60,216 | $172,385 |
| 2018 | $2,693 | $228,041 | $59,036 | $169,005 |
| 2017 | $2,665 | $223,571 | $57,879 | $165,692 |
| 2016 | $2,487 | $219,189 | $56,745 | $162,444 |
| 2015 | $2,444 | $215,897 | $55,893 | $160,004 |
| 2014 | $2,391 | $211,669 | $54,799 | $156,870 |
Source: Public Records
Map
Nearby Homes
- 7214 Saffron Way
- 7230 Linda Sue Way
- 33 Coyle Creek Cir
- 7004 Laurel Oak Way
- 5437 Elsinore Way
- 5513 San Juan Ave
- 5213 Dove Dr
- 7125 Gail Way
- 5645 San Juan Ave
- 5200 Roseana Ct
- 5330 Sable Wood Ln
- 7309 Villa Del Sol Ln
- 7449 Willowcreek Dr
- 6945 Amberwick Way
- 5329 Aldorae St
- 5829 San Juan Ave Unit 5
- 5829 San Juan Ave Unit 39
- 7012 Robin Rd
- 5829 Sperry Dr
- 6757 Judistine Dr
- 5446 Bartig Way
- 5434 Bartig Way
- 7200 Linda Sue Way
- 7148 Linda Sue Way
- 7204 Linda Sue Way
- 5430 Bartig Way
- 7142 Linda Sue Way
- 5443 Bartig Way
- 5437 Bartig Way
- 7208 Linda Sue Way
- 5447 Bartig Way
- 5451 Bartig Way
- 5426 Bartig Way
- 5431 Bartig Way
- 5449 Bartig Way
- 7134 Linda Sue Way
- 7212 Linda Sue Way
- 5425 Bartig Way
- 5500 Sperry Dr
- 5422 Bartig Way