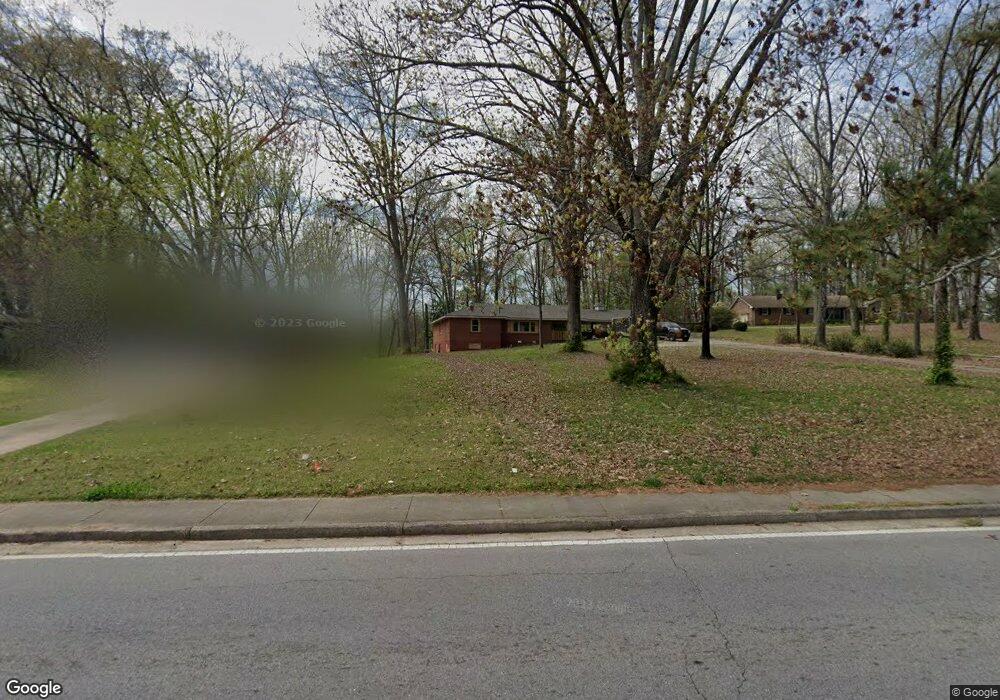
5441 Ash St Forest Park, GA 30297
Estimated Value: $231,000 - $249,000
3
Beds
2
Baths
1,795
Sq Ft
$133/Sq Ft
Est. Value
About This Home
This home is located at 5441 Ash St, Forest Park, GA 30297 and is currently estimated at $238,937, approximately $133 per square foot. 5441 Ash St is a home located in Clayton County with nearby schools including Lake City Elementary School, Babb Middle School, and Forest Park High School.
Ownership History
Date
Name
Owned For
Owner Type
Purchase Details
Closed on
Feb 5, 2021
Sold by
Harrison Troy L
Bought by
Nestlehutt Douglas and Nestlehutt Kathy
Current Estimated Value
Purchase Details
Closed on
Apr 30, 2014
Sold by
Ramsey Carolyn Jane
Bought by
Harrison Troy L
Purchase Details
Closed on
Feb 26, 2013
Sold by
Jones Lois
Bought by
Ramsey Carolyn Jane
Purchase Details
Closed on
May 18, 2004
Sold by
Jones Barton A
Bought by
Jones Elizabeth P
Create a Home Valuation Report for This Property
The Home Valuation Report is an in-depth analysis detailing your home's value as well as a comparison with similar homes in the area
Home Values in the Area
Average Home Value in this Area
Purchase History
| Date | Buyer | Sale Price | Title Company |
|---|---|---|---|
| Nestlehutt Douglas | $162,500 | -- | |
| Harrison Troy L | -- | -- | |
| Ramsey Carolyn Jane | -- | -- | |
| Jones Elizabeth P | -- | -- |
Source: Public Records
Tax History Compared to Growth
Tax History
| Year | Tax Paid | Tax Assessment Tax Assessment Total Assessment is a certain percentage of the fair market value that is determined by local assessors to be the total taxable value of land and additions on the property. | Land | Improvement |
|---|---|---|---|---|
| 2025 | $3,507 | $102,680 | $9,000 | $93,680 |
| 2024 | $3,934 | $112,840 | $9,000 | $103,840 |
| 2023 | $3,458 | $108,200 | $9,000 | $99,200 |
| 2022 | $2,242 | $65,000 | $8,760 | $56,240 |
| 2021 | $1,686 | $48,520 | $9,000 | $39,520 |
| 2020 | $1,439 | $41,007 | $9,000 | $32,007 |
| 2019 | $1,285 | $36,098 | $7,000 | $29,098 |
| 2018 | $1,132 | $31,799 | $7,000 | $24,799 |
| 2017 | $871 | $24,400 | $6,000 | $18,400 |
| 2016 | $871 | $24,400 | $6,000 | $18,400 |
| 2015 | $854 | $0 | $0 | $0 |
| 2014 | $407 | $41,397 | $6,000 | $35,397 |
Source: Public Records
Map
Nearby Homes
- 0 Ash St Unit 10563129
- 5355 Sharon St
- 5344 Sharon St
- 5570 Ash St
- 843 White Oak Dr
- 655 Shellnut Dr Unit 2
- 548 Pineridge Dr Unit 1
- 5489 Ahyoka Dr
- 804 Linda Way
- 5690 Cypress Dr
- 791 Alice St
- 5674 Sandhurst Dr
- 718 South Ave
- 743 Brookwood Dr
- 1112 Reynolds Ct Unit 4
- 5538 Pineridge Ct
- 965 Cone Rd
- 5125 West St
- 865 Oakdale Dr
- 1167 Sanders Dr