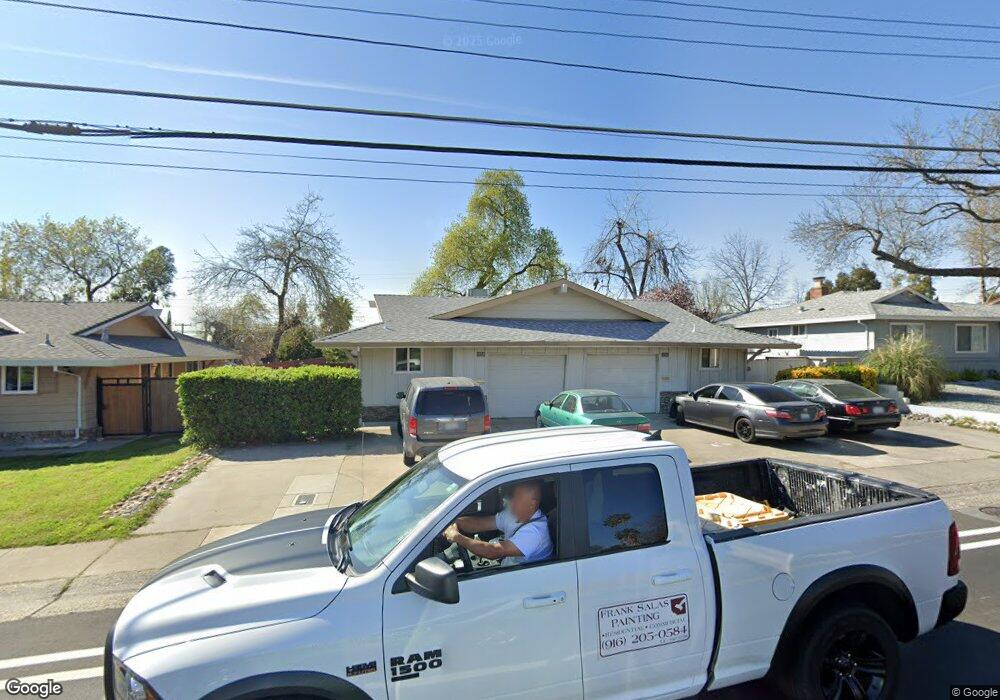
5441 San Juan Ave Citrus Heights, CA 95610
Estimated Value: $426,000 - $571,000
4
Beds
2
Baths
1,920
Sq Ft
$258/Sq Ft
Est. Value
About This Home
This home is located at 5441 San Juan Ave, Citrus Heights, CA 95610 and is currently estimated at $494,856, approximately $257 per square foot. 5441 San Juan Ave is a home located in Sacramento County with nearby schools including Charles Peck Elementary School, Will Rogers Middle School, and San Juan High School.
Ownership History
Date
Name
Owned For
Owner Type
Purchase Details
Closed on
Sep 24, 2011
Sold by
Conti Michael A
Bought by
Conti Michael A and Sestri Trust
Current Estimated Value
Purchase Details
Closed on
Mar 19, 2009
Sold by
Emc Mortgage Corporation
Bought by
Conti Michael A
Purchase Details
Closed on
Nov 20, 2007
Sold by
Bellow August
Bought by
Wells Fargo Bank Na
Purchase Details
Closed on
Sep 18, 2006
Sold by
Bellow Mildred D
Bought by
Bellow August
Home Financials for this Owner
Home Financials are based on the most recent Mortgage that was taken out on this home.
Original Mortgage
$304,000
Interest Rate
7.25%
Mortgage Type
Purchase Money Mortgage
Purchase Details
Closed on
Aug 20, 2004
Sold by
Shields Brent and Estate Of George Samlot
Bought by
Shields Yuba Properties
Create a Home Valuation Report for This Property
The Home Valuation Report is an in-depth analysis detailing your home's value as well as a comparison with similar homes in the area
Home Values in the Area
Average Home Value in this Area
Purchase History
| Date | Buyer | Sale Price | Title Company |
|---|---|---|---|
| Conti Michael A | -- | None Available | |
| Conti Michael A | $140,000 | Orange Coast Title Lender Se | |
| Emc Mortgage Corporation | $140,000 | Orange Coast Title Lender Se | |
| Wells Fargo Bank Na | $305,000 | Accommodation | |
| Bellow August | -- | Placer Title Company | |
| Bellow August | $380,000 | Placer Title Company | |
| Shields Yuba Properties | -- | -- |
Source: Public Records
Mortgage History
| Date | Status | Borrower | Loan Amount |
|---|---|---|---|
| Previous Owner | Bellow August | $304,000 | |
| Previous Owner | Bellow August | $76,000 |
Source: Public Records
Tax History Compared to Growth
Tax History
| Year | Tax Paid | Tax Assessment Tax Assessment Total Assessment is a certain percentage of the fair market value that is determined by local assessors to be the total taxable value of land and additions on the property. | Land | Improvement |
|---|---|---|---|---|
| 2025 | $1,911 | $161,382 | $87,918 | $73,464 |
| 2024 | $1,911 | $158,219 | $86,195 | $72,024 |
| 2023 | $1,863 | $155,117 | $84,505 | $70,612 |
| 2022 | $1,853 | $152,077 | $82,849 | $69,228 |
| 2021 | $1,822 | $149,096 | $81,225 | $67,871 |
| 2020 | $1,789 | $147,569 | $80,393 | $67,176 |
| 2019 | $1,753 | $144,676 | $78,817 | $65,859 |
| 2018 | $1,733 | $141,840 | $77,272 | $64,568 |
| 2017 | $1,716 | $139,059 | $75,757 | $63,302 |
| 2016 | $1,603 | $136,333 | $74,272 | $62,061 |
| 2015 | $1,576 | $134,286 | $73,157 | $61,129 |
| 2014 | $1,543 | $131,656 | $71,724 | $59,932 |
Source: Public Records
Map
Nearby Homes
- 5513 San Juan Ave
- 33 Coyle Creek Cir
- 7230 Linda Sue Way
- 7449 Willowcreek Dr
- 5645 San Juan Ave
- 5664 San Juan Ave
- 5200 Roseana Ct
- 7229 Gail Way
- 7125 Gail Way
- 5718 Southgrove Dr
- 5213 Dove Dr
- 5829 San Juan Ave Unit 5
- 5829 San Juan Ave Unit 39
- 5424 Mariposa Ave
- 5617 Mariposa Ave
- 5437 Elsinore Way
- 7746 Eastgate Ave
- 5829 Sperry Dr
- 7738 Eastgate Ave
- 7632 Capricorn Dr
- 5435 San Juan Ave
- 5447 San Juan Ave
- 5442 Maidstone Way
- 5448 Maidstone Way
- 5436 Maidstone Way
- 5429 San Juan Ave
- 5501 San Juan Ave
- 5500 Maidstone Way
- 5430 Maidstone Way
- 5480 San Juan Ave
- 5507 San Juan Ave
- 5506 San Juan Ave
- 5506 Maidstone Way
- 5424 Maidstone Way
- 5512 San Juan Ave
- 5441 Maidstone Way
- 5435 Maidstone Way
- 5447 Maidstone Way
- 5417 San Juan Ave
- 5512 Maidstone Way