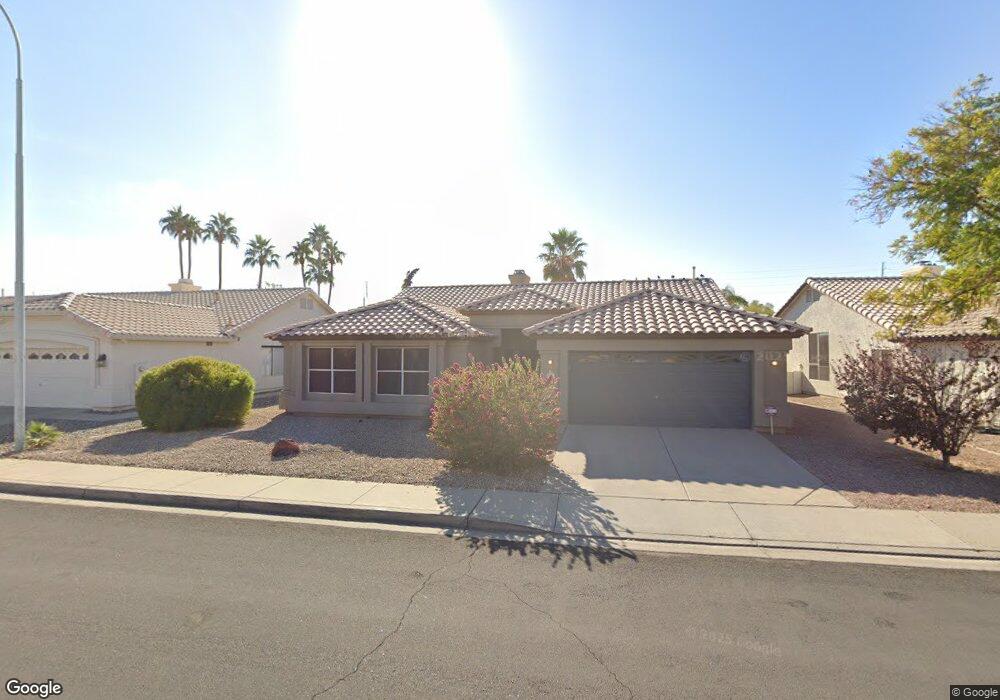
5443 W Geronimo St Chandler, AZ 85226
West Chandler NeighborhoodEstimated Value: $568,795 - $648,000
4
Beds
2
Baths
2,248
Sq Ft
$270/Sq Ft
Est. Value
About This Home
This home is located at 5443 W Geronimo St, Chandler, AZ 85226 and is currently estimated at $606,699, approximately $269 per square foot. 5443 W Geronimo St is a home located in Maricopa County with nearby schools including Kyrene de la Paloma School, Kyrene del Pueblo Middle School, and Mountain Pointe High School.
Ownership History
Date
Name
Owned For
Owner Type
Purchase Details
Closed on
May 30, 2024
Sold by
Molly Omo Living Trust and Omo Molly
Bought by
Omo Molly
Current Estimated Value
Purchase Details
Closed on
Aug 13, 2014
Sold by
Omo Molly
Bought by
Omo Molly and The Molly Omo Living Trust
Purchase Details
Closed on
Apr 9, 2012
Sold by
Hart John G and Hart Jean
Bought by
Omo Molly
Purchase Details
Closed on
Nov 21, 2008
Sold by
Hart John and Hart Jean
Bought by
Hart John G and Hart Jean
Purchase Details
Closed on
Aug 19, 2002
Sold by
Sonley John W
Bought by
Hart John and Hart Jean
Home Financials for this Owner
Home Financials are based on the most recent Mortgage that was taken out on this home.
Original Mortgage
$112,000
Interest Rate
6.24%
Mortgage Type
New Conventional
Purchase Details
Closed on
Mar 6, 1996
Sold by
Pulte Home Corp
Bought by
Sonley John W and Snyder Mary A
Create a Home Valuation Report for This Property
The Home Valuation Report is an in-depth analysis detailing your home's value as well as a comparison with similar homes in the area
Home Values in the Area
Average Home Value in this Area
Purchase History
| Date | Buyer | Sale Price | Title Company |
|---|---|---|---|
| Omo Molly | -- | None Listed On Document | |
| Omo Molly | -- | None Available | |
| Omo Molly | $247,000 | First American Title Ins Co | |
| Hart John G | -- | None Available | |
| Hart John | $212,000 | Capital Title Agency Inc | |
| Sonley John W | $155,970 | Security Title Agency |
Source: Public Records
Mortgage History
| Date | Status | Borrower | Loan Amount |
|---|---|---|---|
| Previous Owner | Hart John | $112,000 |
Source: Public Records
Tax History Compared to Growth
Tax History
| Year | Tax Paid | Tax Assessment Tax Assessment Total Assessment is a certain percentage of the fair market value that is determined by local assessors to be the total taxable value of land and additions on the property. | Land | Improvement |
|---|---|---|---|---|
| 2025 | $2,596 | $32,585 | -- | -- |
| 2024 | $2,483 | $31,034 | -- | -- |
| 2023 | $2,483 | $43,020 | $8,600 | $34,420 |
| 2022 | $2,363 | $33,380 | $6,670 | $26,710 |
| 2021 | $2,492 | $31,610 | $6,320 | $25,290 |
| 2020 | $2,435 | $29,920 | $5,980 | $23,940 |
| 2019 | $2,364 | $29,510 | $5,900 | $23,610 |
| 2018 | $2,286 | $28,460 | $5,690 | $22,770 |
| 2017 | $2,178 | $27,710 | $5,540 | $22,170 |
| 2016 | $2,224 | $27,120 | $5,420 | $21,700 |
| 2015 | $2,052 | $25,910 | $5,180 | $20,730 |
Source: Public Records
Map
Nearby Homes
- 840 S Pineview Dr
- 5361 W Saragosa St
- 5330 W Kesler Ln
- 5580 W Kesler St
- 5041 W Kesler Ln
- 5043 W Whitten St
- 255 S Kyrene Rd Unit 231
- 255 S Kyrene Rd Unit 111
- 5137 W Jupiter Way
- 4790 W Geronimo St
- 5143 W Mercury Way
- 4918 W Chicago St
- 5455 W Buffalo St
- 5882 W Mercury Way
- 4650 W Geronimo St
- 5151 W Glenview Place
- 4624 W Chicago St
- 4613 W Chicago St Unit 2
- 4612 W Jupiter Way
- 300 N Gila Springs Blvd Unit 181
- 5453 W Geronimo St
- 5433 W Geronimo St
- 5440 W Kesler Ln
- 5463 W Geronimo St
- 5450 W Kesler Ln
- 5423 W Geronimo St
- 5430 W Kesler Ln
- 5442 W Geronimo St
- 5420 W Kesler Ln
- 5460 W Kesler Ln
- 5452 W Geronimo St
- 5432 W Geronimo St
- 5413 W Geronimo St
- 5422 W Geronimo St
- 5410 W Kesler Ln
- 5412 W Geronimo St
- 5403 W Geronimo St
- 5400 W Kesler Ln
- 820 S Pineview Dr
- 5441 W Saragosa St