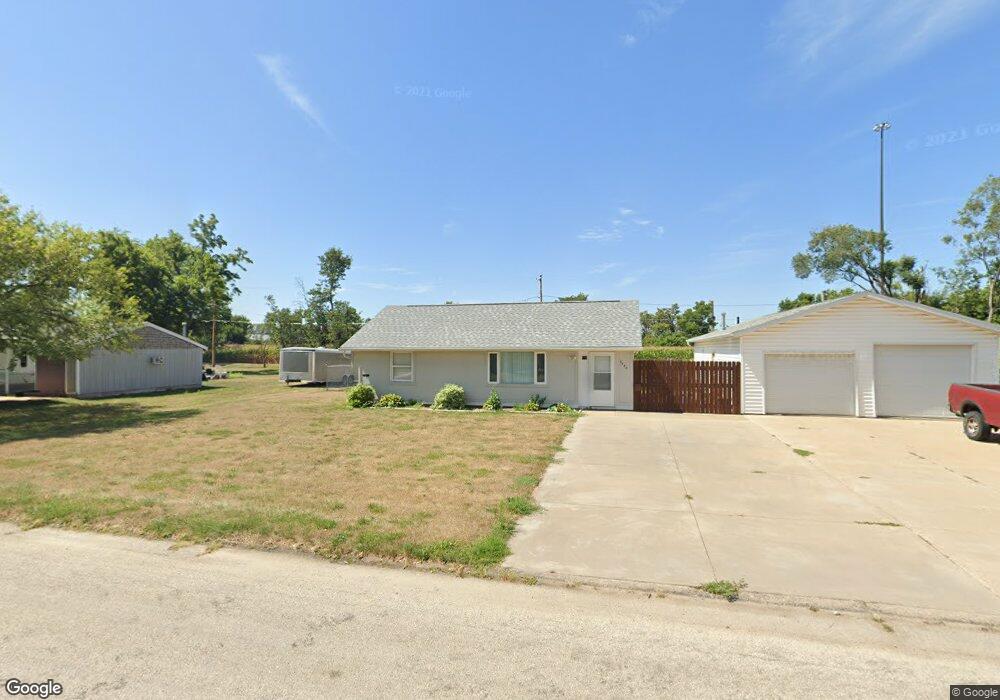
5444 Klinger St SW Cedar Rapids, IA 52404
Lincolnway Village NeighborhoodEstimated Value: $159,000 - $194,000
2
Beds
2
Baths
894
Sq Ft
$197/Sq Ft
Est. Value
About This Home
This home is located at 5444 Klinger St SW, Cedar Rapids, IA 52404 and is currently estimated at $176,111, approximately $196 per square foot. 5444 Klinger St SW is a home located in Linn County with nearby schools including Prairie Heights Elementary School, Prairie Crest Elementary School, and Prairie View Elementary School.
Ownership History
Date
Name
Owned For
Owner Type
Purchase Details
Closed on
Jan 6, 2005
Sold by
Rhodes Steven L and Rhodes Sharon A
Bought by
Booth Jason L
Current Estimated Value
Home Financials for this Owner
Home Financials are based on the most recent Mortgage that was taken out on this home.
Original Mortgage
$92,000
Outstanding Balance
$46,695
Interest Rate
5.83%
Mortgage Type
Unknown
Estimated Equity
$129,416
Purchase Details
Closed on
Dec 31, 2004
Sold by
Zalesky Joseph M
Bought by
Booth Jason L
Home Financials for this Owner
Home Financials are based on the most recent Mortgage that was taken out on this home.
Original Mortgage
$92,000
Outstanding Balance
$46,695
Interest Rate
5.83%
Mortgage Type
Unknown
Estimated Equity
$129,416
Purchase Details
Closed on
Jul 7, 2003
Sold by
Zalesky Joseph M and Rhodes Steven L
Bought by
Bankiowa
Home Financials for this Owner
Home Financials are based on the most recent Mortgage that was taken out on this home.
Original Mortgage
$86,400
Interest Rate
8.62%
Mortgage Type
Seller Take Back
Purchase Details
Closed on
Jun 20, 2003
Sold by
Zalesky Joseph M and Rhodes Steven L
Bought by
Booth Jason L
Home Financials for this Owner
Home Financials are based on the most recent Mortgage that was taken out on this home.
Original Mortgage
$86,400
Interest Rate
8.62%
Mortgage Type
Seller Take Back
Purchase Details
Closed on
Jun 18, 2003
Sold by
Siemering John A and Siemering Darcey L
Bought by
Zalesky Joseph M and Rhodes Steven L
Home Financials for this Owner
Home Financials are based on the most recent Mortgage that was taken out on this home.
Original Mortgage
$86,400
Interest Rate
8.62%
Mortgage Type
Seller Take Back
Create a Home Valuation Report for This Property
The Home Valuation Report is an in-depth analysis detailing your home's value as well as a comparison with similar homes in the area
Home Values in the Area
Average Home Value in this Area
Purchase History
| Date | Buyer | Sale Price | Title Company |
|---|---|---|---|
| Booth Jason L | $96,000 | -- | |
| Booth Jason L | -- | -- | |
| Bankiowa | $77,120 | -- | |
| Booth Jason L | $96,400 | -- | |
| Zalesky Joseph M | $96,000 | -- |
Source: Public Records
Mortgage History
| Date | Status | Borrower | Loan Amount |
|---|---|---|---|
| Open | Booth Jason L | $92,000 | |
| Closed | Booth Jason L | $92,000 | |
| Previous Owner | Booth Jason L | $86,400 | |
| Previous Owner | Zalesky Joseph M | $77,120 |
Source: Public Records
Tax History Compared to Growth
Tax History
| Year | Tax Paid | Tax Assessment Tax Assessment Total Assessment is a certain percentage of the fair market value that is determined by local assessors to be the total taxable value of land and additions on the property. | Land | Improvement |
|---|---|---|---|---|
| 2025 | $2,654 | $159,800 | $31,800 | $128,000 |
| 2024 | $2,498 | $150,500 | $31,800 | $118,700 |
| 2023 | $2,498 | $150,500 | $31,800 | $118,700 |
| 2022 | $2,408 | $121,600 | $27,300 | $94,300 |
| 2021 | $2,342 | $119,800 | $27,300 | $92,500 |
| 2020 | $2,342 | $111,500 | $22,700 | $88,800 |
| 2019 | $2,152 | $104,500 | $22,700 | $81,800 |
| 2018 | $2,090 | $104,500 | $22,700 | $81,800 |
| 2017 | $2,025 | $100,700 | $22,700 | $78,000 |
| 2016 | $2,025 | $93,600 | $22,700 | $70,900 |
| 2015 | $2,241 | $104,111 | $22,737 | $81,374 |
| 2014 | $2,054 | $104,111 | $22,737 | $81,374 |
| 2013 | $1,948 | $104,111 | $22,737 | $81,374 |
Source: Public Records
Map
Nearby Homes
- 270 Miller Ave SW
- 5610 Briarwood St SW
- 5750 J St SW
- 72 Miller Ave SW Unit 8
- 6601 Ohio St SW
- 62 Oklahoma Ave SW
- 5655 Deerwood St SW
- 51 Oklahoma Ave SW
- 6620 Preston Terrace Ct SW
- 7000 Harlan Eddy Dr SW
- 0 6th St & 76th Ave SW Unit 202505956
- 0 41st Avenue Dr SW Unit 202507355
- 0 41st Avenue Dr SW Unit 1 Ac
- 0 41st Avenue Dr SW Unit 2.25 Ac
- 148 33rd Ave SW
- 6812 Artesa Bell Dr SW
- 7006 Colpepper Dr SW
- 9 33rd Ave SW
- 3212 Southland St SW
- 6612 Artesa Bell Dr SW
- 5434 Klinger St SW
- 5454 Klinger St SW
- 5426 Klinger St SW
- 5500 Klinger St SW
- 5441 Klinger St SW
- 5449 Klinger St SW
- 5433 Klinger St SW
- 5457 Klinger St SW
- 5418 Klinger St SW
- 5425 Klinger St SW
- 5501 Klinger St SW
- 5510 Klinger St SW
- 5417 Klinger St SW
- 5507 Klinger St SW
- 5408 Klinger St SW
- 5407 Klinger St SW
- 5515 Klinger St SW
- 5520 Klinger St SW
- 5450 J St SW
- 5442 J St SW