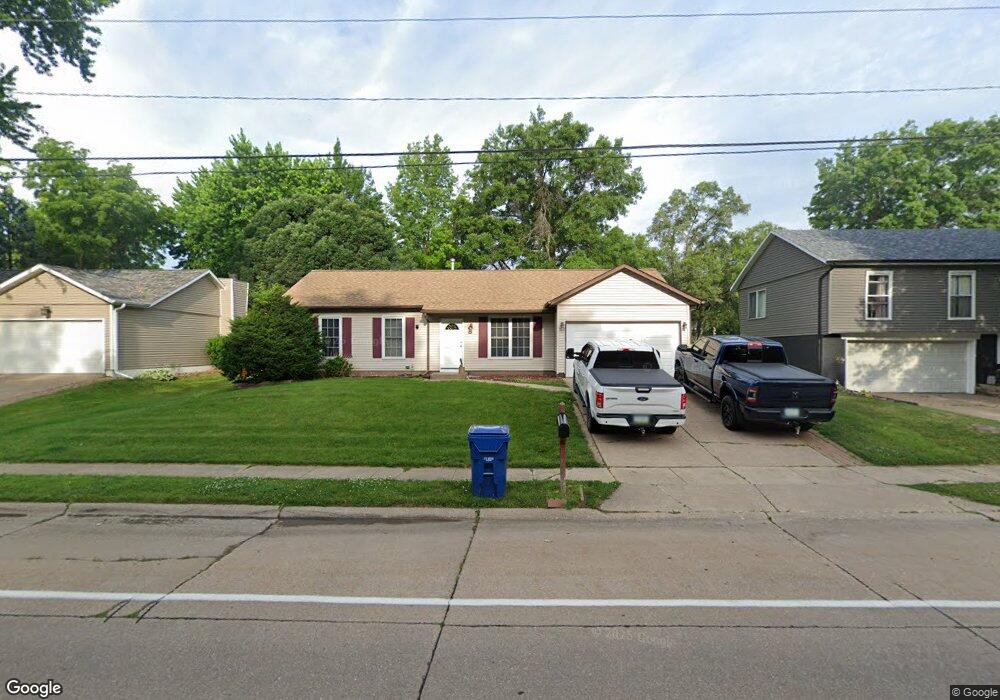
5444 N Marquette St Davenport, IA 52806
North Side NeighborhoodEstimated Value: $220,811 - $264,000
3
Beds
1
Bath
1,180
Sq Ft
$210/Sq Ft
Est. Value
About This Home
This home is located at 5444 N Marquette St, Davenport, IA 52806 and is currently estimated at $247,703, approximately $209 per square foot. 5444 N Marquette St is a home located in Scott County with nearby schools including Cumberland Hall School, Harrison Elementary School, and Academy Of Continuing Education.
Ownership History
Date
Name
Owned For
Owner Type
Purchase Details
Closed on
Jan 10, 2018
Sold by
Wulf John
Bought by
John D Wulf Revocable Trust
Current Estimated Value
Purchase Details
Closed on
Oct 17, 2017
Sold by
Wulf John
Bought by
John D Wulf Revocable Trust
Purchase Details
Closed on
Mar 1, 2017
Sold by
Iossi Roger
Bought by
Wulf John
Purchase Details
Closed on
Jul 15, 2016
Sold by
Kelly Timothy S and Kelly Sheila K
Bought by
Lossi Roger and Lossi Family Trust
Purchase Details
Closed on
Dec 18, 2009
Sold by
Kelly Timothy S and Kelly Sheila K
Bought by
Kelly Timothy S and Kelly Sheila K
Home Financials for this Owner
Home Financials are based on the most recent Mortgage that was taken out on this home.
Original Mortgage
$82,600
Interest Rate
4.96%
Mortgage Type
New Conventional
Create a Home Valuation Report for This Property
The Home Valuation Report is an in-depth analysis detailing your home's value as well as a comparison with similar homes in the area
Home Values in the Area
Average Home Value in this Area
Purchase History
| Date | Buyer | Sale Price | Title Company |
|---|---|---|---|
| John D Wulf Revocable Trust | -- | None Available | |
| John D Wulf Revocable Trust | -- | None Available | |
| Wulf John | $157,500 | None Available | |
| Lossi Roger | $150,000 | None Available | |
| Kelly Timothy S | -- | None Available |
Source: Public Records
Mortgage History
| Date | Status | Borrower | Loan Amount |
|---|---|---|---|
| Previous Owner | Kelly Timothy S | $82,600 |
Source: Public Records
Tax History Compared to Growth
Tax History
| Year | Tax Paid | Tax Assessment Tax Assessment Total Assessment is a certain percentage of the fair market value that is determined by local assessors to be the total taxable value of land and additions on the property. | Land | Improvement |
|---|---|---|---|---|
| 2025 | $3,508 | $209,810 | $40,430 | $169,380 |
| 2024 | $3,424 | $196,340 | $40,430 | $155,910 |
| 2023 | $3,792 | $196,340 | $40,430 | $155,910 |
| 2022 | $3,810 | $177,510 | $34,910 | $142,600 |
| 2021 | $3,810 | $177,510 | $34,910 | $142,600 |
| 2020 | $3,720 | $163,820 | $34,910 | $128,910 |
| 2019 | $3,828 | $162,680 | $34,910 | $127,770 |
| 2018 | $3,448 | $162,680 | $34,910 | $127,770 |
| 2017 | $873 | $156,970 | $34,910 | $122,060 |
| 2016 | $3,072 | $148,990 | $0 | $0 |
| 2015 | $3,187 | $138,750 | $0 | $0 |
| 2014 | $2,888 | $135,250 | $0 | $0 |
| 2013 | $2,758 | $0 | $0 | $0 |
| 2012 | -- | $129,910 | $35,930 | $93,980 |
Source: Public Records
Map
Nearby Homes
- 5721 Taylor St
- 5735 Taylor St
- 5804 Lillie Ave
- 1033 W 58th St
- 1005 W 58th St
- 1415 W 59th St
- 4757 Willow Cir
- 4743 Willow Cir
- 4942 Brown St
- 825 Northbrook Dr
- 6015 Vine St
- 5436 N Division St
- 5510 N Division St
- 4804 Northwest Blvd
- 5210 N Division St
- 1729 Welshire Dr
- 1301 W 62nd Ct
- 4705 N Sturdevant St
- 4618 Fillmore Ln
- 4612 Warren St Unit 5
- 5444 Marquette St
- 5450 Marquette St
- 5450 N Marquette St
- 5436 Marquette St
- 5456 Marquette St
- 5428 Marquette St
- 5431 Taylor St
- 5437 Taylor St
- 5425 Taylor St
- 5508 Quercus Ln
- 5445 Taylor St
- 5420 Marquette St
- 5520 Quercus Ln
- 5419 Taylor St
- 5453 Taylor St
- 5412 Marquette St
- 5461 Taylor St
- 5411 Taylor St
- 5420 Taylor St
- 5515 Quercus Ln