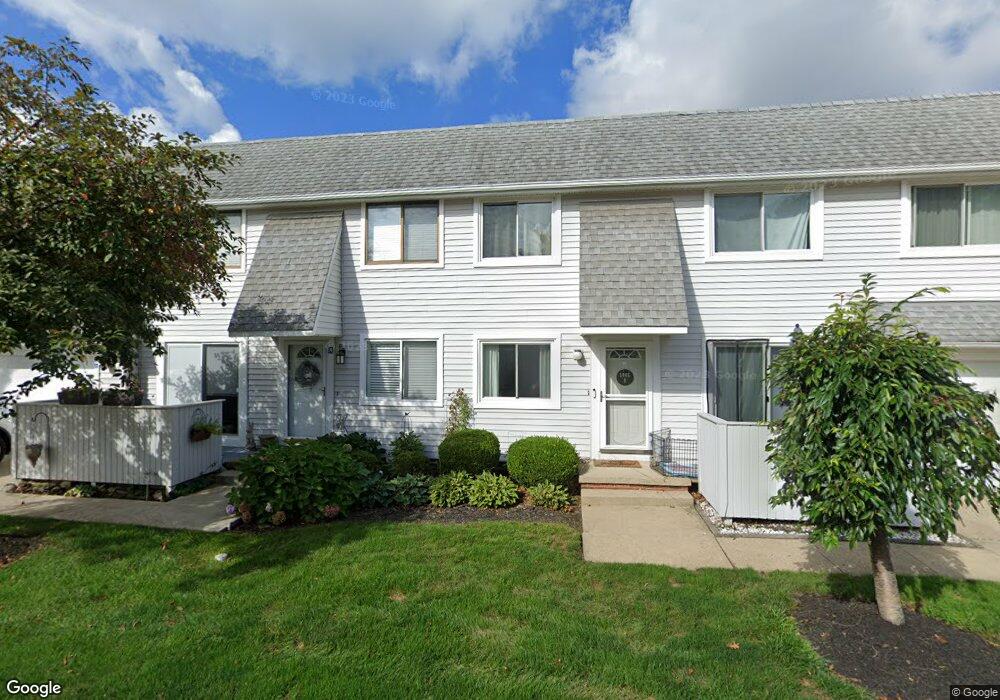
5446 Haven Ct Unit B70 Willoughby, OH 44094
Downtown Willoughby NeighborhoodEstimated Value: $154,720 - $169,000
3
Beds
2
Baths
770
Sq Ft
$209/Sq Ft
Est. Value
About This Home
This home is located at 5446 Haven Ct Unit B70, Willoughby, OH 44094 and is currently estimated at $161,180, approximately $209 per square foot. 5446 Haven Ct Unit B70 is a home located in Lake County with nearby schools including Edison Elementary School, Willoughby Middle School, and South High School.
Ownership History
Date
Name
Owned For
Owner Type
Purchase Details
Closed on
Apr 29, 2021
Sold by
Yackin Michael Casey
Bought by
Zenone Laura Alexandra
Current Estimated Value
Home Financials for this Owner
Home Financials are based on the most recent Mortgage that was taken out on this home.
Original Mortgage
$102,600
Outstanding Balance
$92,836
Interest Rate
3%
Mortgage Type
New Conventional
Estimated Equity
$68,344
Purchase Details
Closed on
May 25, 2016
Sold by
Yackin Micahel Casey and Divincenso Leslie
Bought by
Yackin Micahel Casey
Purchase Details
Closed on
Jan 11, 2006
Sold by
Stein Patricia C
Bought by
Yackin Michael Casey
Home Financials for this Owner
Home Financials are based on the most recent Mortgage that was taken out on this home.
Original Mortgage
$93,600
Interest Rate
6.34%
Mortgage Type
Fannie Mae Freddie Mac
Purchase Details
Closed on
Aug 19, 1983
Bought by
Stein Patricia C
Create a Home Valuation Report for This Property
The Home Valuation Report is an in-depth analysis detailing your home's value as well as a comparison with similar homes in the area
Home Values in the Area
Average Home Value in this Area
Purchase History
| Date | Buyer | Sale Price | Title Company |
|---|---|---|---|
| Zenone Laura Alexandra | $109,250 | Title Professionals Group Lt | |
| Yackin Micahel Casey | -- | None Available | |
| Yackin Michael Casey | $117,000 | Real Living Title Agency Ltd | |
| Stein Patricia C | -- | -- |
Source: Public Records
Mortgage History
| Date | Status | Borrower | Loan Amount |
|---|---|---|---|
| Open | Zenone Laura Alexandra | $102,600 | |
| Previous Owner | Yackin Michael Casey | $93,600 |
Source: Public Records
Tax History Compared to Growth
Tax History
| Year | Tax Paid | Tax Assessment Tax Assessment Total Assessment is a certain percentage of the fair market value that is determined by local assessors to be the total taxable value of land and additions on the property. | Land | Improvement |
|---|---|---|---|---|
| 2024 | -- | $41,570 | $13,860 | $27,710 |
| 2023 | $3,521 | $37,190 | $11,740 | $25,450 |
| 2022 | $2,303 | $37,190 | $11,740 | $25,450 |
| 2021 | $2,311 | $37,190 | $11,740 | $25,450 |
| 2020 | $2,130 | $30,490 | $9,630 | $20,860 |
| 2019 | $1,977 | $30,490 | $9,630 | $20,860 |
| 2018 | $1,865 | $26,210 | $6,620 | $19,590 |
| 2017 | $1,784 | $26,210 | $6,620 | $19,590 |
| 2016 | $1,777 | $26,210 | $6,620 | $19,590 |
| 2015 | $1,705 | $26,210 | $6,620 | $19,590 |
| 2014 | $1,618 | $26,210 | $6,620 | $19,590 |
| 2013 | $1,619 | $26,210 | $6,620 | $19,590 |
Source: Public Records
Map
Nearby Homes
- 5465 Millwood Ln Unit 40-C
- 5463 Millwood Ln Unit 42C
- 5510 Wildwood Ct Unit 81-A
- 34675 Oak Tree Dr
- 34840 Aspen Wood Ln
- 1705 Douglas Rd
- 1648 Douglas Rd
- 30811 Grant St
- 1569 Douglas Rd
- 5171 Jude Ct
- 34615 Ethan Way
- 1560 Douglas Rd
- 5085 Shepherds Glen
- 5083 Shepherds Glen
- 5084 Shepherds Glen
- 35005 Lisle Ct
- 5081 Shepherds Glen
- 5082 Shepherds Glen
- 5079 Shepherds Glen
- 5080 Shepherds Glen
- 5446 Haven Ct Unit 70-C
- 5446 Haven Ct Unit D70
- 5446 Haven Ct Unit C70
- 5446 Haven Ct Unit A70
- 5446 Haven Ct Unit 70-B
- 5444 Haven Ct Unit D67
- 5444 Haven Ct Unit C67
- 5444 Haven Ct Unit B67
- 5444 Haven Ct Unit A67
- 5444 Haven Ct Unit C
- 5444 Haven Ct Unit 67-C
- 5426 Haven Ct Unit D
- 5426 Haven Ct Unit D69
- 5426 Haven Ct Unit C69
- 5426 Haven Ct Unit B69
- 5426 Haven Ct Unit A69
- 5426 Haven Ct Unit 69-C
- 5426 Haven Ct Unit C
- 5426 Haven Ct Unit 69-D
- 5454 Sierra Dr Unit D71