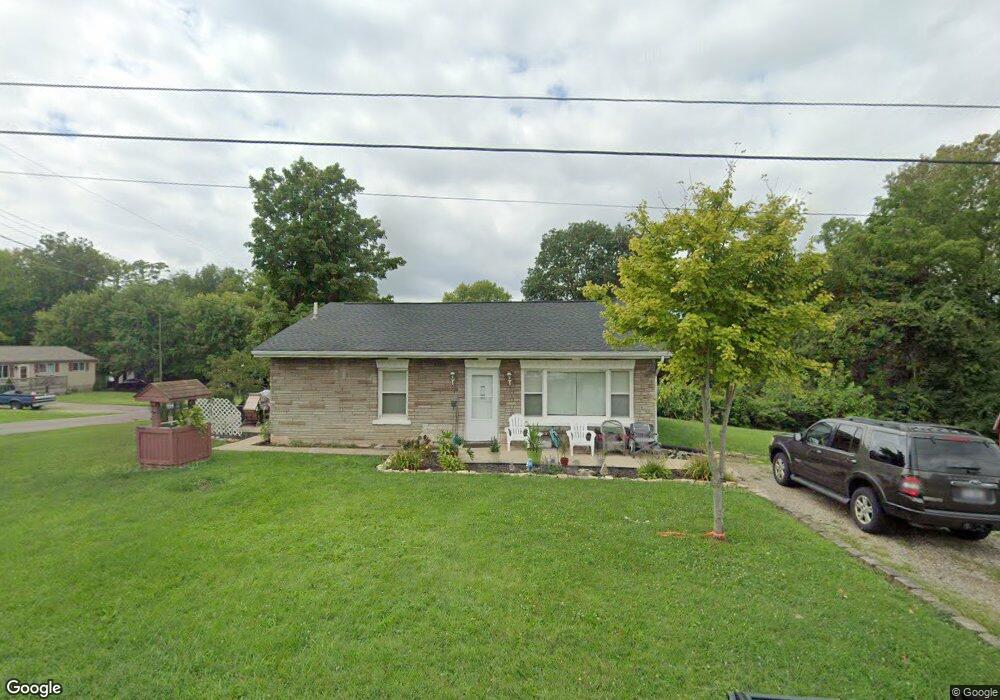
5447 Hinton St Franklin, OH 45005
Estimated Value: $184,524 - $235,000
3
Beds
1
Bath
1,152
Sq Ft
$179/Sq Ft
Est. Value
About This Home
This home is located at 5447 Hinton St, Franklin, OH 45005 and is currently estimated at $205,881, approximately $178 per square foot. 5447 Hinton St is a home located in Warren County with nearby schools including Franklin High School, Summit Academy Community School for Alternative Learners - Middletown, and Summit Academy Secondary School - Middletown.
Ownership History
Date
Name
Owned For
Owner Type
Purchase Details
Closed on
Nov 27, 2023
Sold by
Moreland Family Trust
Bought by
Moreland Legacy Properties Llc
Current Estimated Value
Purchase Details
Closed on
Mar 29, 2019
Sold by
Moreland James E and Moreland Jim
Bought by
Moreland Family Trust
Purchase Details
Closed on
Feb 14, 2011
Sold by
National Bank & Trust Company
Bought by
Moreland James E
Purchase Details
Closed on
Jul 30, 2010
Sold by
Combs Richard L and Case #09-Cv-75678
Bought by
Community National Bank and National Bank & Trust Company
Purchase Details
Closed on
Jan 13, 1989
Sold by
Foster & Jody K & Trustee
Bought by
Combs Combs and Combs Richard L
Purchase Details
Closed on
Jan 5, 1989
Sold by
Patterson Patterson and Patterson Clarence
Bought by
Foster & Jody K & Trustee
Create a Home Valuation Report for This Property
The Home Valuation Report is an in-depth analysis detailing your home's value as well as a comparison with similar homes in the area
Home Values in the Area
Average Home Value in this Area
Purchase History
| Date | Buyer | Sale Price | Title Company |
|---|---|---|---|
| Moreland Legacy Properties Llc | -- | None Listed On Document | |
| Moreland Family Trust | -- | None Available | |
| Moreland James E | $38,000 | Middletown Title | |
| Community National Bank | $40,000 | Attorney | |
| Combs Combs | $35,500 | -- | |
| Foster & Jody K & Trustee | $26,400 | -- |
Source: Public Records
Tax History Compared to Growth
Tax History
| Year | Tax Paid | Tax Assessment Tax Assessment Total Assessment is a certain percentage of the fair market value that is determined by local assessors to be the total taxable value of land and additions on the property. | Land | Improvement |
|---|---|---|---|---|
| 2024 | $1,913 | $43,290 | $15,080 | $28,210 |
| 2023 | $1,605 | $31,972 | $7,910 | $24,062 |
| 2022 | $1,569 | $31,973 | $7,910 | $24,063 |
| 2021 | $1,481 | $31,973 | $7,910 | $24,063 |
| 2020 | $1,426 | $27,094 | $6,703 | $20,391 |
| 2019 | $1,291 | $27,094 | $6,703 | $20,391 |
| 2018 | $1,263 | $27,094 | $6,703 | $20,391 |
| 2017 | $1,229 | $23,447 | $5,985 | $17,462 |
| 2016 | $1,227 | $23,447 | $5,985 | $17,462 |
| 2015 | $1,227 | $23,447 | $5,985 | $17,462 |
| 2014 | $1,253 | $23,450 | $5,990 | $17,460 |
| 2013 | $1,064 | $26,250 | $6,700 | $19,550 |
Source: Public Records
Map
Nearby Homes
- 5845 Manchester Rd
- 5756 Union Rd
- 25 Timber Creek Dr
- 220 Pleasant Hill Blvd
- 60 Pleasant Hill Blvd
- 5696 Woodcreek Dr
- 5667 Woodcreek Dr
- 6777 Crystal Harbour Dr
- 5714 Millbrook Dr
- 6795 Crystal Harbour Dr
- 5760 Autumn Dr
- 6772 Rivulet Dr
- 4640 Shaker Rd
- 5031 Gerber Dr
- 5019 Waterford Ln
- Creekside Paired Villa Plan at Waterford Place
- 4964 Timberline Dr Unit 81
- 209 Arcadia Dr
- 4840 Shannon Way
- 4904 Timberline Dr Unit 84
- 5856 Lynn St
- 5452 Hinton St
- 5868 Lynn St
- 5825 Manchester Rd
- 5839 Lynn St
- 5802 Lynn St
- 5855 Lynn St
- 5815 Lynn St
- 5884 Lynn St
- 5815 Manchester Rd
- 5867 Lynn St
- 5788 Lynn St
- 5801 Lynn St
- 5801 Manchester Rd
- 5901 Manchester Rd
- 5901 Manchester Rd
- 5772 Lynn St
- 5828 Manchester Rd
- 5771 Lynn St
- 5787 Manchester Rd