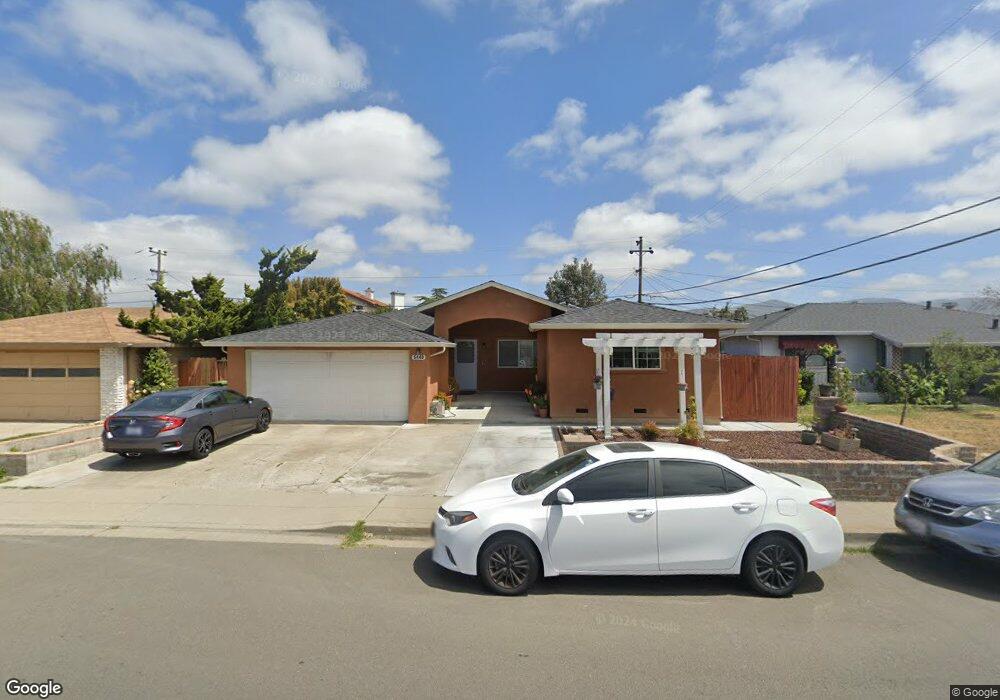
5448 Butano Park Dr Fremont, CA 94538
Blacow NeighborhoodEstimated Value: $1,438,000 - $1,633,000
5
Beds
3
Baths
1,612
Sq Ft
$931/Sq Ft
Est. Value
About This Home
This home is located at 5448 Butano Park Dr, Fremont, CA 94538 and is currently estimated at $1,500,431, approximately $930 per square foot. 5448 Butano Park Dr is a home located in Alameda County with nearby schools including Steven Millard Elementary, G.M. Walters Middle School, and John F. Kennedy High School.
Ownership History
Date
Name
Owned For
Owner Type
Purchase Details
Closed on
Jan 9, 2015
Sold by
Minh P Nguyen & Phuong L Pham Revocable
Bought by
Minh P Nguyen & Phuong L Pham Revocable
Current Estimated Value
Home Financials for this Owner
Home Financials are based on the most recent Mortgage that was taken out on this home.
Original Mortgage
$200,000
Outstanding Balance
$70,097
Interest Rate
3.87%
Mortgage Type
New Conventional
Estimated Equity
$1,430,334
Purchase Details
Closed on
Aug 24, 2005
Sold by
Nguyen Minh P and Pham Phuong
Bought by
Minh P Nguyen & Phuong L Pham Revocable
Purchase Details
Closed on
Oct 26, 1998
Sold by
Pickard Scott and Pickard Maureen P
Bought by
Nguyen Minh P and Pham Phuong
Home Financials for this Owner
Home Financials are based on the most recent Mortgage that was taken out on this home.
Original Mortgage
$203,200
Interest Rate
6.6%
Create a Home Valuation Report for This Property
The Home Valuation Report is an in-depth analysis detailing your home's value as well as a comparison with similar homes in the area
Home Values in the Area
Average Home Value in this Area
Purchase History
| Date | Buyer | Sale Price | Title Company |
|---|---|---|---|
| Minh P Nguyen & Phuong L Pham Revocable | -- | Old Republic Title | |
| Minh P Nguyen & Phuong L Pham Revocable | -- | -- | |
| Nguyen Minh P | $254,000 | Old Republic Title Company |
Source: Public Records
Mortgage History
| Date | Status | Borrower | Loan Amount |
|---|---|---|---|
| Open | Minh P Nguyen & Phuong L Pham Revocable | $200,000 | |
| Previous Owner | Nguyen Minh P | $203,200 |
Source: Public Records
Tax History Compared to Growth
Tax History
| Year | Tax Paid | Tax Assessment Tax Assessment Total Assessment is a certain percentage of the fair market value that is determined by local assessors to be the total taxable value of land and additions on the property. | Land | Improvement |
|---|---|---|---|---|
| 2025 | $5,853 | $452,730 | $119,452 | $340,278 |
| 2024 | $5,853 | $443,719 | $117,111 | $333,608 |
| 2023 | $5,685 | $441,883 | $114,815 | $327,068 |
| 2022 | $5,596 | $426,219 | $112,564 | $320,655 |
| 2021 | $5,462 | $417,726 | $110,357 | $314,369 |
| 2020 | $5,428 | $420,371 | $109,225 | $311,146 |
| 2019 | $5,368 | $412,130 | $107,084 | $305,046 |
| 2018 | $5,260 | $404,051 | $104,985 | $299,066 |
| 2017 | $5,129 | $396,130 | $102,927 | $293,203 |
| 2016 | $5,033 | $388,364 | $100,909 | $287,455 |
| 2015 | $4,357 | $331,311 | $99,393 | $231,918 |
| 2014 | $4,275 | $324,821 | $97,446 | $227,375 |
Source: Public Records
Map
Nearby Homes
- 5341 Audubon Park Ct
- 4860 Bryce Canyon Park Dr
- 40422 Landon Ave
- 4751 Wadsworth Ct
- 4537 Capewood Terrace
- 4533 Capewood Terrace
- 40696 Robin St
- 4840 Piper St
- 43163 Grimmer Terrace
- 5580 Hemlock Terrace
- 42932 Peachwood St
- 5560 Boscell Common
- 4309 Bora Ave
- 39997 Cedar Blvd Unit 153
- 41882 Gifford St
- 39975 Cedar Blvd Unit 136
- 39850 Sundale Dr
- 48 Eagle Green
- 39857 Pelton Terrace
- 40116 Crockett St
- 5456 Butano Park Dr
- 5440 Butano Park Dr
- 5447 Fiesta Rd
- 5464 Butano Park Dr
- 5455 Fiesta Rd
- 5439 Fiesta Rd
- 5453 Butano Park Dr
- 5445 Butano Park Dr
- 5463 Fiesta Rd
- 5461 Butano Park Dr
- 5472 Butano Park Dr
- 5424 Butano Park Dr
- 5437 Butano Park Dr
- 5471 Fiesta Rd
- 5489 Valpey Park Ave
- 5429 Butano Park Dr
- 5480 Butano Park Dr
- 5477 Butano Park Dr
- 5416 Butano Park Dr
- 5465 Valpey Park Ave