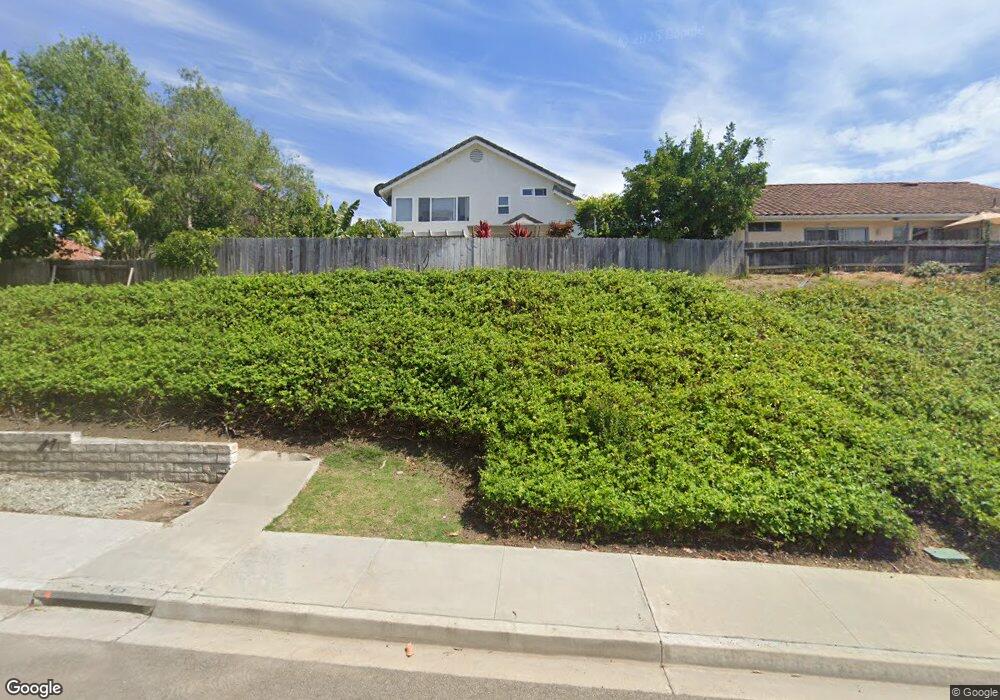
5448 Loganberry Way Oceanside, CA 92057
Guajome NeighborhoodEstimated Value: $835,626 - $912,000
3
Beds
3
Baths
1,749
Sq Ft
$501/Sq Ft
Est. Value
About This Home
This home is located at 5448 Loganberry Way, Oceanside, CA 92057 and is currently estimated at $876,157, approximately $500 per square foot. 5448 Loganberry Way is a home located in San Diego County with nearby schools including Mission Meadows Elementary School, Roosevelt Middle School, and Vista High School.
Ownership History
Date
Name
Owned For
Owner Type
Purchase Details
Closed on
Oct 22, 2024
Sold by
Hoover Colleen Joan
Bought by
Colleen J Hoover Revocable Living Trust and Hoover
Current Estimated Value
Purchase Details
Closed on
Sep 14, 2024
Sold by
Hoover Family Trust and Hoover Charles G
Bought by
Hoover Colleen Joan
Purchase Details
Closed on
Aug 27, 2024
Sold by
Hoover Colleen Joan
Bought by
Colleen J Hoover Revocable Living Trust and Hoover
Purchase Details
Closed on
Jan 10, 2024
Sold by
Hoover Charles Gordon
Bought by
Hoover Colleen Joan
Purchase Details
Closed on
Jul 26, 2012
Sold by
Hoover Charles Gordon and Hoover Colleen Joan
Bought by
Hoover Charles G and Hoover Colleen J
Purchase Details
Closed on
Sep 22, 1989
Bought by
Hoover Charles G Colleen J
Create a Home Valuation Report for This Property
The Home Valuation Report is an in-depth analysis detailing your home's value as well as a comparison with similar homes in the area
Home Values in the Area
Average Home Value in this Area
Purchase History
| Date | Buyer | Sale Price | Title Company |
|---|---|---|---|
| Colleen J Hoover Revocable Living Trust | -- | None Listed On Document | |
| Hoover Colleen Joan | -- | None Listed On Document | |
| Colleen J Hoover Revocable Living Trust | -- | None Listed On Document | |
| Hoover Colleen Joan | -- | None Listed On Document | |
| Hoover Charles G | -- | None Available | |
| Hoover Charles G Colleen J | $179,000 | -- |
Source: Public Records
Tax History
| Year | Tax Paid | Tax Assessment Tax Assessment Total Assessment is a certain percentage of the fair market value that is determined by local assessors to be the total taxable value of land and additions on the property. | Land | Improvement |
|---|---|---|---|---|
| 2025 | $3,545 | $329,283 | $85,886 | $243,397 |
| 2024 | $3,545 | $322,827 | $84,202 | $238,625 |
| 2023 | $3,460 | $316,498 | $82,551 | $233,947 |
| 2022 | $3,451 | $310,293 | $80,933 | $229,360 |
| 2021 | $3,374 | $304,210 | $79,347 | $224,863 |
| 2020 | $3,363 | $301,092 | $78,534 | $222,558 |
| 2019 | $3,313 | $295,190 | $76,995 | $218,195 |
| 2018 | $3,150 | $289,403 | $75,486 | $213,917 |
| 2017 | $3,091 | $283,729 | $74,006 | $209,723 |
| 2016 | $3,017 | $278,166 | $72,555 | $205,611 |
| 2015 | $3,006 | $273,989 | $71,466 | $202,523 |
| 2014 | $2,932 | $268,623 | $70,067 | $198,556 |
Source: Public Records
Map
Nearby Homes
- 554 Edgewater Ave
- 114 Arlow Way
- 5517 Old Ranch Rd Unit 29
- 111 Metz Way
- 120 Alethea Way
- 110 Takamasa Way
- 122 Alethea Way
- 107 Metz Way
- 119 Takamasa Way
- 5538 Dora Way
- 5462 Mae Way
- 5572 Alethea Way
- 1489 Goldrush Way
- 1684 Charlie Horse Way
- 124 Alethea Way
- 1681 Charlie Horse Way
- 5654 Tumbleweed Way
- 149 Mellano Way
- 161 Mellano Way
- 1690 Bronco Way
- 5452 Loganberry Way
- 5444 Loganberry Way
- 5456 Loganberry Way
- 5440 Loganberry Way
- 5460 Loganberry Way
- 5447 Loganberry Way Unit 2
- 5443 Loganberry Way
- 5436 Loganberry Way
- 5451 Loganberry Way
- 5455 Loganberry Way
- 5419 Gooseberry Way
- 5415 Gooseberry Way
- 5432 Loganberry Way
- 5423 Gooseberry Way
- 5459 Loganberry Way
- 5411 Gooseberry Way
- 5427 Gooseberry Way Unit 2
- 5428 Loganberry Way
- 5423 Loganberry Way
- 5464 Loganberry Way
Your Personal Tour Guide
Ask me questions while you tour the home.