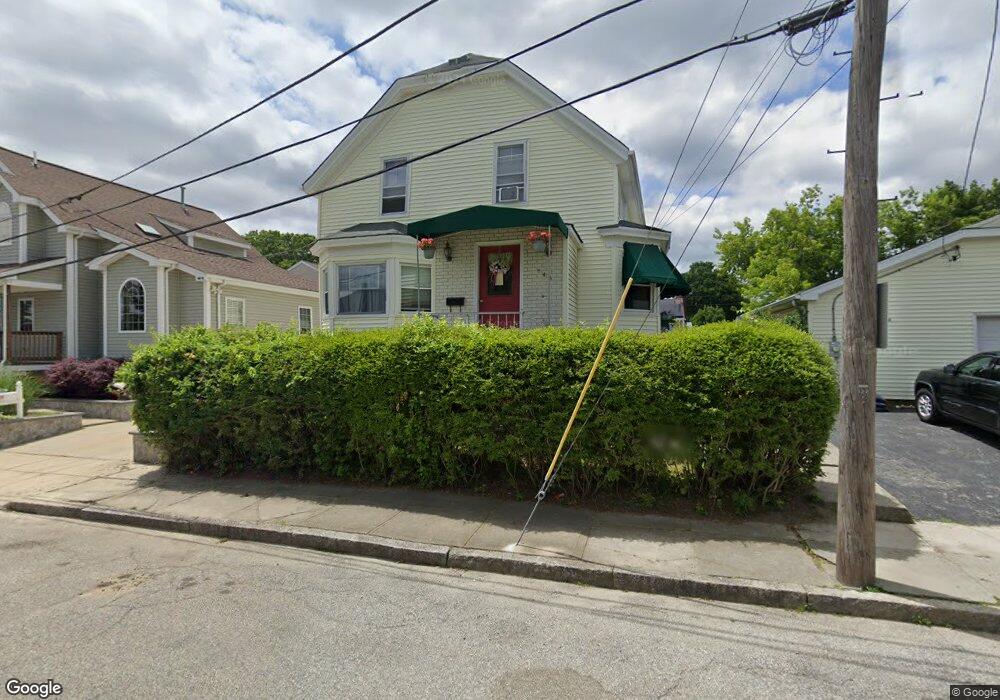
545 Baker St Fall River, MA 02721
Maplewood NeighborhoodEstimated Value: $360,000 - $459,000
3
Beds
2
Baths
1,445
Sq Ft
$289/Sq Ft
Est. Value
About This Home
This home is located at 545 Baker St, Fall River, MA 02721 and is currently estimated at $417,645, approximately $289 per square foot. 545 Baker St is a home located in Bristol County with nearby schools including Letourneau Elementary School, Talbot Innovation School, and B M C Durfee High School.
Ownership History
Date
Name
Owned For
Owner Type
Purchase Details
Closed on
Jun 6, 2025
Sold by
Duarte Patricia
Bought by
Duarte Patricia and White Joseph
Current Estimated Value
Purchase Details
Closed on
May 25, 2001
Sold by
Chace Howard R
Bought by
Duarte Robert and Duarte Patricia
Create a Home Valuation Report for This Property
The Home Valuation Report is an in-depth analysis detailing your home's value as well as a comparison with similar homes in the area
Home Values in the Area
Average Home Value in this Area
Purchase History
| Date | Buyer | Sale Price | Title Company |
|---|---|---|---|
| Duarte Patricia | -- | None Available | |
| Duarte Patricia | -- | None Available | |
| Duarte Robert | $145,000 | -- | |
| Duarte Robert | $145,000 | -- |
Source: Public Records
Mortgage History
| Date | Status | Borrower | Loan Amount |
|---|---|---|---|
| Previous Owner | Duarte Robert | $60,000 | |
| Previous Owner | Duarte Robert | $84,037 |
Source: Public Records
Tax History
| Year | Tax Paid | Tax Assessment Tax Assessment Total Assessment is a certain percentage of the fair market value that is determined by local assessors to be the total taxable value of land and additions on the property. | Land | Improvement |
|---|---|---|---|---|
| 2025 | $4,356 | $380,400 | $132,200 | $248,200 |
| 2024 | $4,117 | $358,300 | $127,200 | $231,100 |
| 2023 | $3,859 | $314,500 | $109,000 | $205,500 |
| 2022 | $3,580 | $283,700 | $99,100 | $184,600 |
| 2021 | $3,326 | $240,500 | $91,700 | $148,800 |
| 2020 | $3,325 | $230,100 | $87,800 | $142,300 |
| 2019 | $3,196 | $219,200 | $83,600 | $135,600 |
| 2018 | $2,944 | $201,400 | $82,000 | $119,400 |
| 2017 | $2,831 | $202,200 | $83,700 | $118,500 |
| 2016 | $2,733 | $200,500 | $87,200 | $113,300 |
| 2015 | $2,579 | $197,200 | $83,900 | $113,300 |
| 2014 | $2,537 | $201,700 | $88,400 | $113,300 |
Source: Public Records
Map
Nearby Homes
- 545 Brayton Ave
- 1350 Rodman St
- 21 Boyden St
- 59 Denver St
- 231 Lapham St
- 311 S Oxford St
- 10 Aberdeen St
- 582 Cambridge St
- 248 Jefferson St
- 495 Chicago St
- 539 Aetna St
- 20 Reeves St
- 59 Wayne St
- 304 Cambridge St
- 883 Grinnell St
- 405 Warren St
- 118 Jefferson St
- 889 Grinnell St Unit 7
- 889 Grinnell St Unit 8
- 889 Grinnell St Unit 2
Your Personal Tour Guide
Ask me questions while you tour the home.