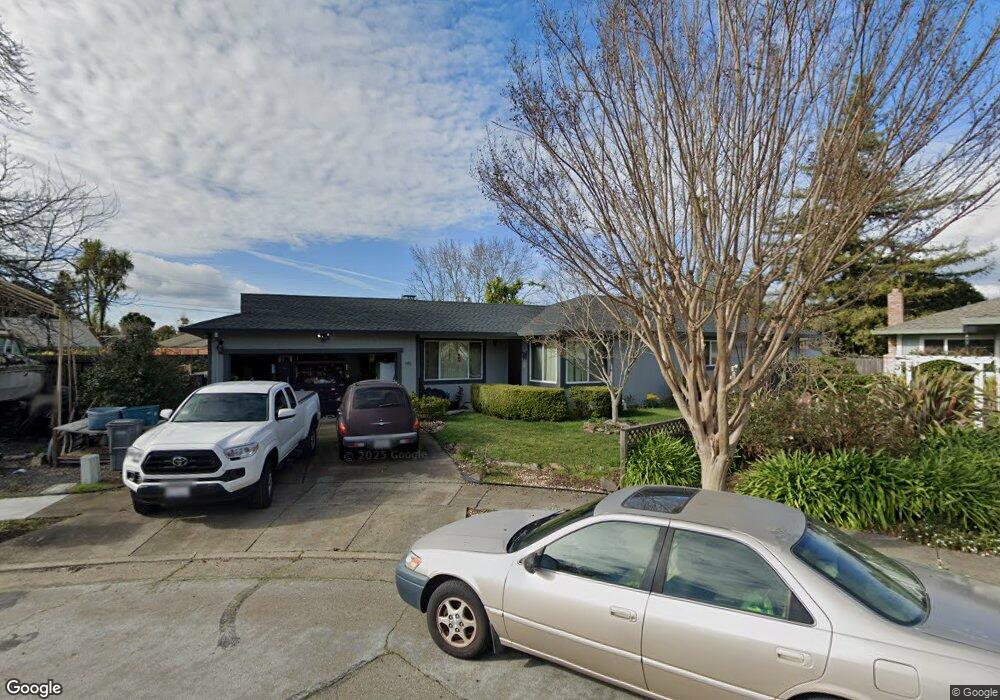
545 Duncan St Santa Rosa, CA 95401
Estimated Value: $572,000 - $691,000
3
Beds
2
Baths
1,412
Sq Ft
$458/Sq Ft
Est. Value
About This Home
This home is located at 545 Duncan St, Santa Rosa, CA 95401 and is currently estimated at $646,455, approximately $457 per square foot. 545 Duncan St is a home located in Sonoma County with nearby schools including Abraham Lincoln Elementary School, Santa Rosa Middle School, and Santa Rosa High School.
Ownership History
Date
Name
Owned For
Owner Type
Purchase Details
Closed on
Sep 2, 2014
Sold by
Wildman Stephen and Wildman Marylin J
Bought by
Wildman Family Living Trust
Current Estimated Value
Purchase Details
Closed on
Jan 28, 1998
Sold by
Bentley Wesley E and Bentley Theodora D
Bought by
Wildman Stephen and Wildman Marylin J
Home Financials for this Owner
Home Financials are based on the most recent Mortgage that was taken out on this home.
Original Mortgage
$115,000
Outstanding Balance
$20,268
Interest Rate
6.95%
Estimated Equity
$626,187
Create a Home Valuation Report for This Property
The Home Valuation Report is an in-depth analysis detailing your home's value as well as a comparison with similar homes in the area
Home Values in the Area
Average Home Value in this Area
Purchase History
| Date | Buyer | Sale Price | Title Company |
|---|---|---|---|
| Wildman Family Living Trust | -- | None Available | |
| Wildman Stephen | $154,545 | Chicago Title Co |
Source: Public Records
Mortgage History
| Date | Status | Borrower | Loan Amount |
|---|---|---|---|
| Open | Wildman Stephen | $115,000 |
Source: Public Records
Tax History Compared to Growth
Tax History
| Year | Tax Paid | Tax Assessment Tax Assessment Total Assessment is a certain percentage of the fair market value that is determined by local assessors to be the total taxable value of land and additions on the property. | Land | Improvement |
|---|---|---|---|---|
| 2025 | $3,020 | $271,428 | $103,779 | $167,649 |
| 2024 | $3,020 | $266,107 | $101,745 | $164,362 |
| 2023 | $3,020 | $260,890 | $99,750 | $161,140 |
| 2022 | $2,787 | $255,776 | $97,795 | $157,981 |
| 2021 | $2,751 | $250,762 | $95,878 | $154,884 |
| 2020 | $2,744 | $248,191 | $94,895 | $153,296 |
| 2019 | $2,728 | $243,326 | $93,035 | $150,291 |
| 2018 | $2,711 | $238,556 | $91,211 | $147,345 |
| 2017 | $2,661 | $233,879 | $89,423 | $144,456 |
| 2016 | $2,634 | $229,294 | $87,670 | $141,624 |
| 2015 | $2,554 | $225,851 | $86,354 | $139,497 |
| 2014 | $2,398 | $221,428 | $84,663 | $136,765 |
Source: Public Records
Map
Nearby Homes
- 415 Duncan St
- 303 Hewett St
- 164 N Dutton Ave Unit 7
- 493 Umland Dr
- 209 Decoe St
- 904 Renee Ct
- 223 Decker St
- 919 Kingwood St
- 100 W 8th St
- 930 Kingwood St
- 729 Rockwell Place
- 1538 Surrey Dr
- 706 Simpson Place
- 70 Romani Ct
- 595 N Dutton Ave
- 62 Romani Ct
- 139 Sandalwood Ct
- 743 Davis St
- 59 Roundelay Ln
- 759 Simpson Place