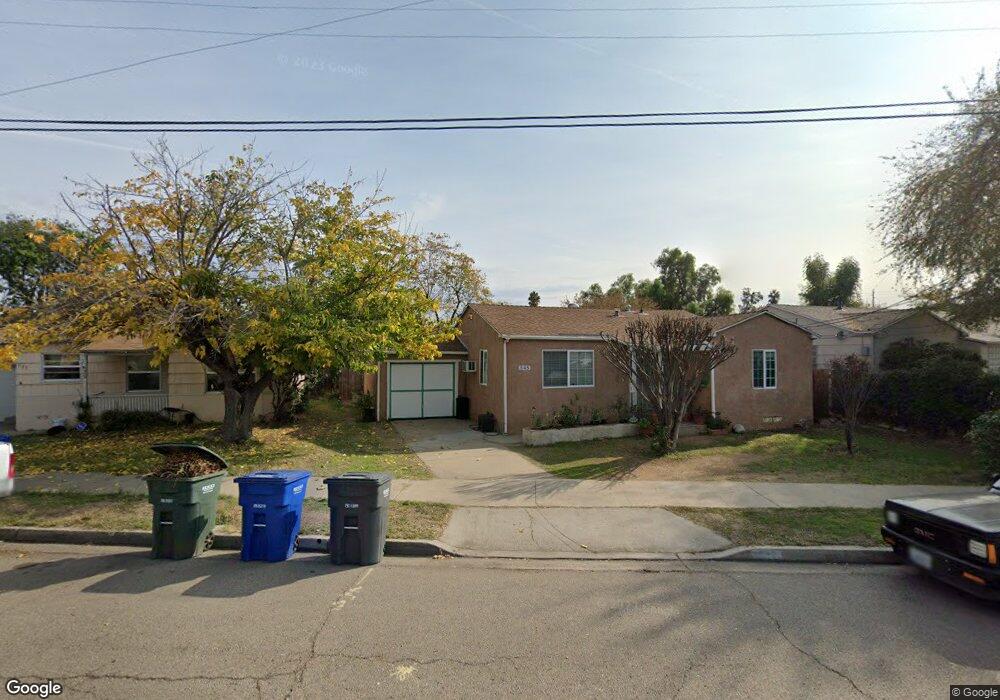
545 Jefferson Ave El Cajon, CA 92020
Estimated Value: $658,000 - $747,000
3
Beds
2
Baths
1,258
Sq Ft
$565/Sq Ft
Est. Value
About This Home
This home is located at 545 Jefferson Ave, El Cajon, CA 92020 and is currently estimated at $710,612, approximately $564 per square foot. 545 Jefferson Ave is a home located in San Diego County with nearby schools including Chase Avenue Elementary School, Cajon Valley Middle School, and Grossmont High School.
Ownership History
Date
Name
Owned For
Owner Type
Purchase Details
Closed on
Apr 12, 2000
Sold by
Swjt Hisaw Sandra L and Noyes Evelyn M
Bought by
Hopper James W and Hopper Abigail
Current Estimated Value
Home Financials for this Owner
Home Financials are based on the most recent Mortgage that was taken out on this home.
Original Mortgage
$169,320
Outstanding Balance
$57,967
Interest Rate
8.22%
Mortgage Type
VA
Estimated Equity
$652,645
Purchase Details
Closed on
Apr 22, 1992
Purchase Details
Closed on
Nov 21, 1983
Create a Home Valuation Report for This Property
The Home Valuation Report is an in-depth analysis detailing your home's value as well as a comparison with similar homes in the area
Purchase History
| Date | Buyer | Sale Price | Title Company |
|---|---|---|---|
| Hopper James W | $167,500 | First American Title | |
| -- | $142,000 | -- | |
| -- | $83,000 | -- |
Source: Public Records
Mortgage History
| Date | Status | Borrower | Loan Amount |
|---|---|---|---|
| Open | Hopper James W | $169,320 |
Source: Public Records
Tax History
| Year | Tax Paid | Tax Assessment Tax Assessment Total Assessment is a certain percentage of the fair market value that is determined by local assessors to be the total taxable value of land and additions on the property. | Land | Improvement |
|---|---|---|---|---|
| 2025 | $3,530 | $257,421 | $107,577 | $149,844 |
| 2024 | $3,530 | $252,374 | $105,468 | $146,906 |
| 2023 | $3,412 | $247,426 | $103,400 | $144,026 |
| 2022 | $3,376 | $242,575 | $101,373 | $141,202 |
| 2021 | $3,349 | $237,820 | $99,386 | $138,434 |
| 2020 | $3,243 | $235,382 | $98,367 | $137,015 |
| 2019 | $2,760 | $230,768 | $96,439 | $134,329 |
| 2018 | $2,714 | $226,245 | $94,549 | $131,696 |
| 2017 | $30 | $221,810 | $92,696 | $129,114 |
| 2016 | $2,569 | $217,462 | $90,879 | $126,583 |
| 2015 | $2,555 | $214,196 | $89,514 | $124,682 |
| 2014 | $2,504 | $210,001 | $87,761 | $122,240 |
Source: Public Records
Map
Nearby Homes
- 637 Jefferson Ave
- 175 E Washington Ave
- 527 Claydelle Ave
- 307 E Washington Ave
- 154 Lindell Ave
- 792 Avocado Ave Unit 26
- 792 Avocado Ave Unit 25
- 469 Taft Ave
- 333 W Lexington Ave Unit D
- 0 Rea Ave
- 403 Emerald Ave Unit 8
- 477 S Lincoln Ave
- 896 Salina St
- 732 E Lexington Ave Unit 19
- 606 S Mollison Ave Unit A
- 545 Sandstone Ct
- 514 Cobblestone Ct
- 539 Sandstone Ct
- 508 Cobblestone Ct
- 1000 Estes St Unit 44
- 605 Jefferson Ave
- 535 Jefferson Ave
- 611 Jefferson Ave
- 525 Jefferson Ave
- 534 Prescott Ave
- 544 Prescott Ave
- 604 Prescott Ave
- 524 Prescott Ave
- 619 Jefferson Ave
- 610 Prescott Ave
- 515 Jefferson Ave
- 553 S Magnolia Ave
- 514 Prescott Ave
- 618 Prescott Ave
- 627 Jefferson Ave
- 636 Prescott Ave
- 515 Prescott Ave
- 645 Jefferson Ave
- 535 Prescott Ave
- 644 Prescott Ave
Your Personal Tour Guide
Ask me questions while you tour the home.