Estimated Value: $252,000 - $458,000
5
Beds
2
Baths
2,900
Sq Ft
$120/Sq Ft
Est. Value
About This Home
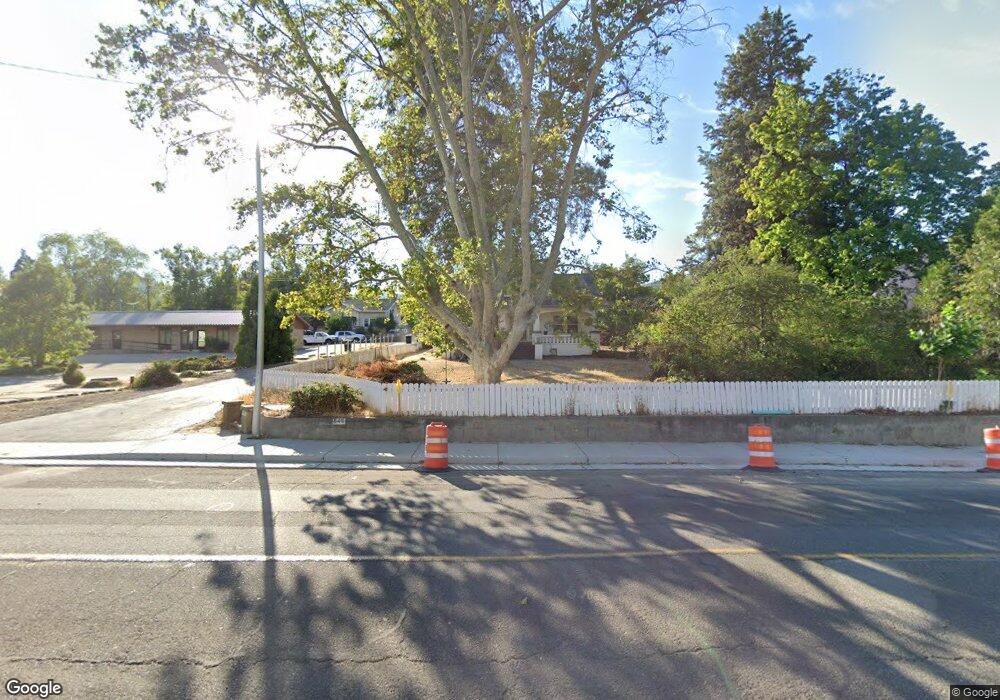
This home is located at 545 N Main St, Yreka, CA 96097 and is currently estimated at $349,064, approximately $120 per square foot. 545 N Main St is a home located in Siskiyou County with nearby schools including Evergreen Elementary School, Jackson Street Elementary School, and Yreka High School.
Ownership History
Date
Name
Owned For
Owner Type
Purchase Details
Closed on
Aug 3, 2016
Sold by
Wade Gary L
Bought by
Nelson Lauren T and Nelson Emily J
Current Estimated Value
Home Financials for this Owner
Home Financials are based on the most recent Mortgage that was taken out on this home.
Original Mortgage
$264,000
Outstanding Balance
$211,184
Interest Rate
3.56%
Mortgage Type
Seller Take Back
Estimated Equity
$137,880
Purchase Details
Closed on
Mar 19, 2008
Sold by
Abbott Roger
Bought by
Purchase Wade Gary L
Home Financials for this Owner
Home Financials are based on the most recent Mortgage that was taken out on this home.
Original Mortgage
$265,500
Interest Rate
5.65%
Mortgage Type
Seller Take Back
Purchase Details
Closed on
Mar 28, 2001
Sold by
Smith Jamie Hayesel and Smith Harriet Evelyn
Bought by
Smith Jamie Hayesel and Smith Harriet Evelyn
Create a Home Valuation Report for This Property
The Home Valuation Report is an in-depth analysis detailing your home's value as well as a comparison with similar homes in the area
Home Values in the Area
Average Home Value in this Area
Purchase History
| Date | Buyer | Sale Price | Title Company |
|---|---|---|---|
| Nelson Lauren T | $265,000 | Mstc | |
| Purchase Wade Gary L | $169,509 | Mt Shasta Title & Escrow Co | |
| Smith Jamie Hayesel | -- | -- |
Source: Public Records
Mortgage History
| Date | Status | Borrower | Loan Amount |
|---|---|---|---|
| Open | Nelson Lauren T | $264,000 | |
| Previous Owner | Purchase Wade Gary L | $265,500 |
Source: Public Records
Tax History
| Year | Tax Paid | Tax Assessment Tax Assessment Total Assessment is a certain percentage of the fair market value that is determined by local assessors to be the total taxable value of land and additions on the property. | Land | Improvement |
|---|---|---|---|---|
| 2025 | $3,079 | $307,549 | $75,435 | $232,114 |
| 2023 | $3,079 | $295,607 | $72,506 | $223,101 |
| 2022 | $2,960 | $289,812 | $71,085 | $218,727 |
| 2021 | $2,908 | $284,131 | $69,692 | $214,439 |
| 2020 | $2,888 | $281,219 | $68,978 | $212,241 |
| 2019 | $2,837 | $275,706 | $67,626 | $208,080 |
| 2018 | $2,780 | $270,300 | $66,300 | $204,000 |
| 2017 | $2,727 | $265,000 | $65,000 | $200,000 |
| 2016 | $3,253 | $308,936 | $88,763 | $220,173 |
| 2015 | $3,204 | $304,296 | $87,430 | $216,866 |
| 2014 | $3,088 | $298,336 | $85,718 | $212,618 |
Source: Public Records
Map
Nearby Homes
- 324 W Blake St
- 304 W Lennox St
- 1420 Cedar View Ln
- 00 Tebbe St
- 0 Pine St Unit 20240671
- 0000 Whipple Way
- 816 Knapp St
- 0 Hill St
- 208 N Oregon St
- 851 Knapp St
- 106 N West St
- 754 Yama St
- 614 Lane St
- 0 Discovery St
- 648 Lane St
- 518 Butte St
- 109 N Fairchild St
- 1130 Discovery St
- 925 W Miner St
- 1127 Discovery St
Your Personal Tour Guide
Ask me questions while you tour the home.