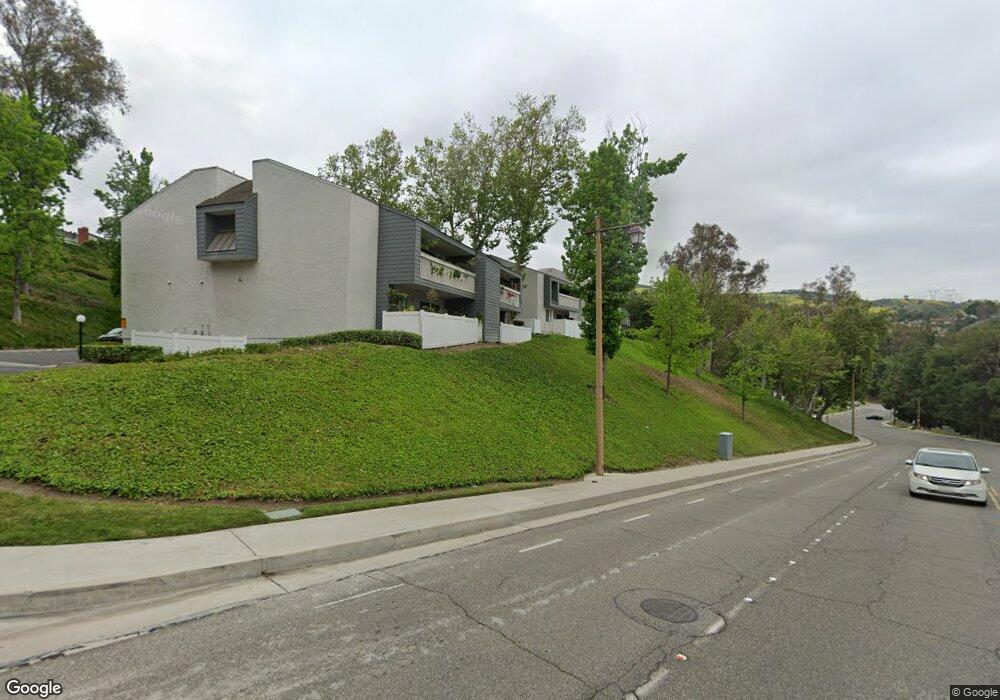
545 S Ranch View Cir Unit 91 Anaheim, CA 92807
Anaheim Hills NeighborhoodEstimated Value: $1,220,000 - $1,806,000
3
Beds
2
Baths
3,408
Sq Ft
$407/Sq Ft
Est. Value
About This Home
This home is located at 545 S Ranch View Cir Unit 91, Anaheim, CA 92807 and is currently estimated at $1,387,650, approximately $407 per square foot. 545 S Ranch View Cir Unit 91 is a home located in Orange County with nearby schools including Canyon Rim Elementary, Canyon High School, and El Rancho Charter.
Ownership History
Date
Name
Owned For
Owner Type
Purchase Details
Closed on
Jul 1, 2005
Sold by
Rafidi Said and Rafidi Sofi
Bought by
Rafidi Said W and Rafidi Sofi S
Current Estimated Value
Purchase Details
Closed on
May 17, 2001
Sold by
Zarrabi Nariman
Bought by
Rafidi Said and Rafidi Sofi
Home Financials for this Owner
Home Financials are based on the most recent Mortgage that was taken out on this home.
Original Mortgage
$300,000
Interest Rate
7.99%
Purchase Details
Closed on
Nov 12, 1998
Sold by
Brooks Nedjiin
Bought by
Brooks Hubie
Home Financials for this Owner
Home Financials are based on the most recent Mortgage that was taken out on this home.
Original Mortgage
$224,000
Interest Rate
9.7%
Purchase Details
Closed on
Oct 26, 1998
Sold by
Hubie Brooks
Bought by
Zarrabi Nariman
Home Financials for this Owner
Home Financials are based on the most recent Mortgage that was taken out on this home.
Original Mortgage
$224,000
Interest Rate
9.7%
Create a Home Valuation Report for This Property
The Home Valuation Report is an in-depth analysis detailing your home's value as well as a comparison with similar homes in the area
Home Values in the Area
Average Home Value in this Area
Purchase History
| Date | Buyer | Sale Price | Title Company |
|---|---|---|---|
| Rafidi Said W | -- | Gateway Title Company | |
| Rafidi Said | $400,000 | American Title Co | |
| Brooks Hubie | -- | Benefit Land Title Company | |
| Zarrabi Nariman | $280,000 | Benefit Land Title |
Source: Public Records
Mortgage History
| Date | Status | Borrower | Loan Amount |
|---|---|---|---|
| Previous Owner | Rafidi Said | $300,000 | |
| Previous Owner | Zarrabi Nariman | $224,000 | |
| Closed | Rafidi Said | $20,000 |
Source: Public Records
Tax History Compared to Growth
Tax History
| Year | Tax Paid | Tax Assessment Tax Assessment Total Assessment is a certain percentage of the fair market value that is determined by local assessors to be the total taxable value of land and additions on the property. | Land | Improvement |
|---|---|---|---|---|
| 2025 | $6,511 | $590,914 | $304,234 | $286,680 |
| 2024 | $6,511 | $579,328 | $298,269 | $281,059 |
| 2023 | $6,367 | $567,969 | $292,420 | $275,549 |
| 2022 | $6,244 | $556,833 | $286,686 | $270,147 |
| 2021 | $6,070 | $545,915 | $281,065 | $264,850 |
| 2020 | $6,014 | $540,318 | $278,183 | $262,135 |
| 2019 | $5,939 | $529,724 | $272,728 | $256,996 |
| 2018 | $5,849 | $519,338 | $267,381 | $251,957 |
| 2017 | $5,607 | $509,155 | $262,138 | $247,017 |
| 2016 | $5,499 | $499,172 | $256,998 | $242,174 |
| 2015 | $5,428 | $491,674 | $253,137 | $238,537 |
| 2014 | $5,314 | $482,043 | $248,178 | $233,865 |
Source: Public Records
Map
Nearby Homes
- 536 S Circulo Lazo
- 6070 E Summit Ct Unit 48
- 397 S San Vicente Ln Unit 31
- 562 S Covered Wagon Trail
- 6073 E Butterfield Ln
- 5997 E Calle Principia
- 660 S Covered Wagon Trail
- 265 S Leandro St
- 6220 E Garnet Cir
- 6550 E Via Corral
- 770 S Stillwater Ln
- 752 S Stillwater Ln
- 6554 E Via Estrada
- 6587 E Via Arboles
- 241 S Solomon Dr
- 5901 E Firenze Crescent
- 830 S Sapphire Ln
- 840 S Shanada Ct
- 6520 E Camino Vista Unit 1
- 2571 N Skytop Ct
- 545 S Ranch View Cir Unit 97
- 545 S Ranch View Cir Unit 96
- 545 S Ranch View Cir Unit 94
- 545 S Ranch View Cir Unit 90
- 545 S Ranch View Cir
- 545 S Ranch View Cir Unit 92
- 545 S Ranch View Cir Unit 94-97
- 545 S Ranch View Cir Unit 9
- 555 S Ranch View Cir Unit 108
- 555 S Ranch View Cir
- 555 S Ranch View Cir Unit 100
- 555 S Ranch View Cir Unit 110
- 555 S Ranch View Cir Unit 100102
- 555 S Ranch View Cir Unit 11
- 555 S Ranch View Cir Unit 12
- 555 S Ranch View Cir Unit 13
- 535 S Ranch View Cir
- 535 S Ranch View Cir Unit 70
- 535 S Ranch View Cir Unit 71
- 535 S Ranch View Cir Unit 7