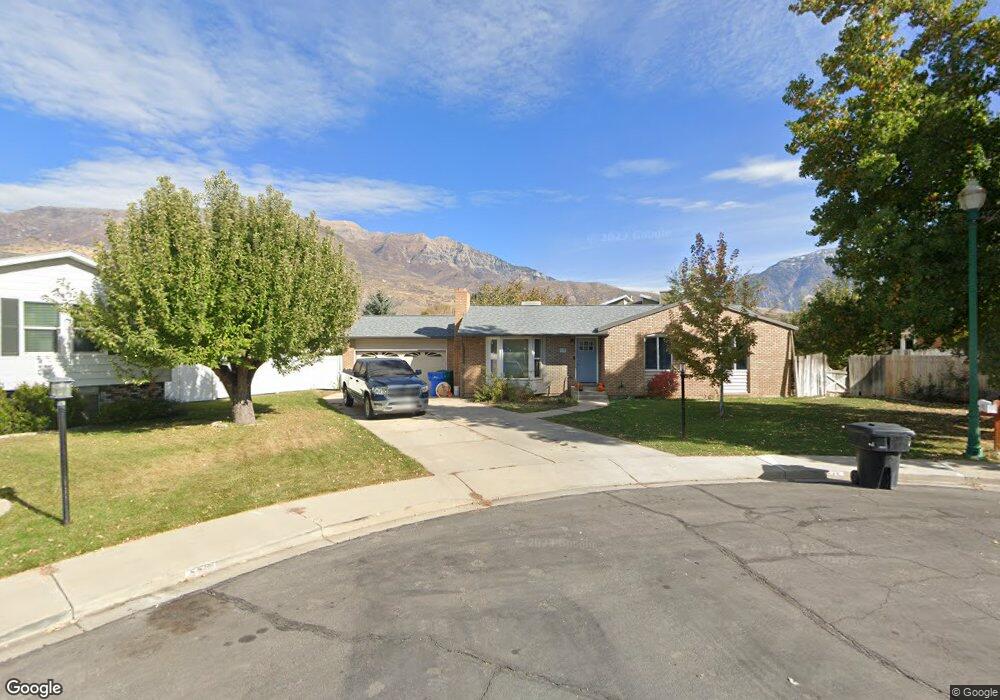
545 W 1960 N Orem, UT 84057
Northridge NeighborhoodEstimated Value: $484,000 - $662,000
About This Home
This home is located at 545 W 1960 N, Orem, UT 84057 and is currently estimated at $568,348, approximately $231 per square foot. 545 W 1960 N is a home located in Utah County with nearby schools including Northridge Elementary School, Oak Canyon Junior High School, and Timpanogos High School.
Ownership History
We collect this data history from publicly available records. To have your information removed, we recommend requesting removal directly through your county’s website.
Purchase Details
Purchase Details
Home Financials for this Owner
Home Financials are based on the most recent Mortgage that was taken out on this home.Purchase Details
Home Values in the Area
Average Home Value in this Area
Purchase History
We collect this data history from publicly available records. To have your information removed, we recommend requesting removal directly through your county’s website.
| Date | Buyer | Sale Price | Title Company |
|---|---|---|---|
| -- | Skyline Title Llc | ||
| -- | Fidelity Land & Title | ||
| -- | Fidelity Land & Title | ||
| -- | None Available |
Mortgage History
We collect this data history from publicly available records. To have your information removed, we recommend requesting removal directly through your county’s website.
| Date | Status | Borrower | Loan Amount |
|---|---|---|---|
| Open | $148,000 |
Tax History
We collect this data history from publicly available records. To have your information removed, we recommend requesting removal directly through your county’s website.
| Year | Tax Paid | Tax Assessment Tax Assessment Total Assessment is a certain percentage of the fair market value that is determined by local assessors to be the total taxable value of land and additions on the property. | Land | Improvement |
|---|---|---|---|---|
| 2025 | $2,211 | $287,320 | -- | -- |
| 2024 | $2,211 | $270,380 | $0 | $0 |
| 2023 | $2,052 | $269,720 | $0 | $0 |
| 2022 | $2,083 | $265,265 | $0 | $0 |
| 2021 | $1,816 | $350,300 | $155,100 | $195,200 |
| 2020 | $1,665 | $315,500 | $124,100 | $191,400 |
| 2019 | $1,474 | $290,500 | $124,100 | $166,400 |
| 2018 | $1,505 | $283,500 | $117,100 | $166,400 |
| 2017 | $1,352 | $136,400 | $0 | $0 |
| 2016 | $1,323 | $123,035 | $0 | $0 |
| 2015 | $1,323 | $116,380 | $0 | $0 |
| 2014 | $1,316 | $115,225 | $0 | $0 |
Map
- 1916 N 430 W
- 682 W 1870 N Unit 11
- 90 S 200 E
- 240 E Center St
- 1917 N 860 W
- 1643 N 645 W
- 229 E 60 N
- 164 W 1880 N
- 1552 N 740 W
- 1545 N State St Unit 1
- 927 W 1670 N
- 1547 N 275 West St Unit 5
- 190 E 800 N Unit 4
- 150 E 800 N Unit 2
- 170 E 800 N Unit 3
- 130 E 800 N Unit 1
- 487 W 1500 N
- 471 W 1500 N
- 1566 N 275 West St Unit 1
- 1548 N 275 West St Unit 2
- 556 W 1960 N
- 1957 N 520 W
- 551 W 1960 N
- 1947 N 520 W
- 551 W 2000 N
- 541 W 2000 N
- 568 W 1960 N
- 563 W 2000 N
- 544 W 1930 N
- 1950 Ribbonwood Dr
- 1967 N 520 W
- 1980 Ribbonwood Dr W
- 585 W 2000 N
- 1941 N 520 W
- 1938 Ribbonwood Dr W
- 1938 Ribbonwood Dr
- 1980 Ribbonwood Dr
- 525 W 2000 N
- 1949 Ribbonwood Dr
- 1959 Ribbonwood Dr
Ask me questions while you tour the home.