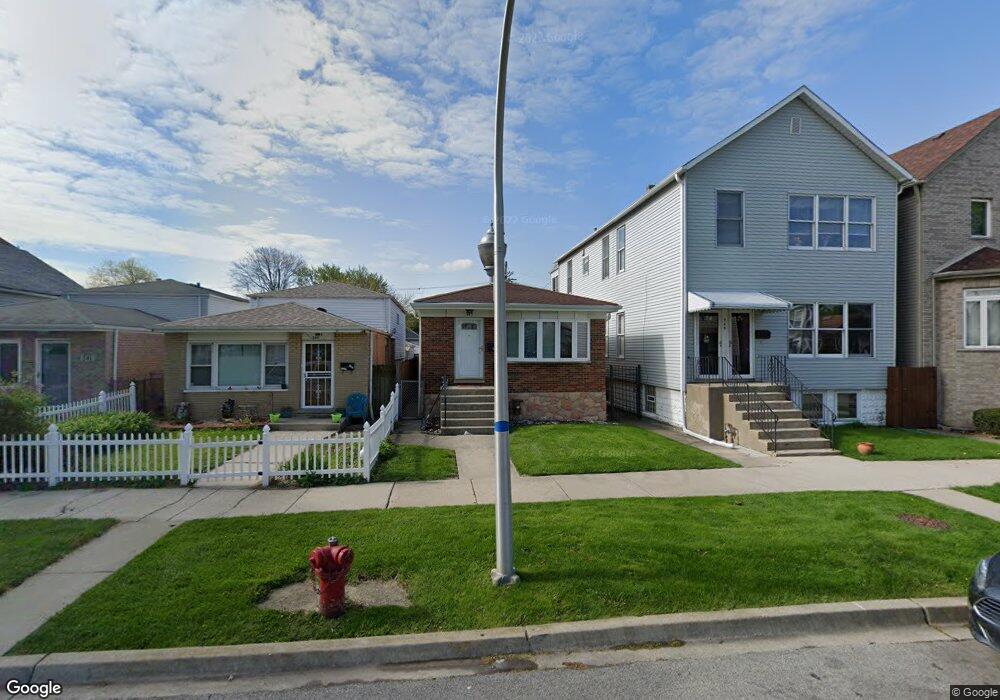
545 W 43rd Place Chicago, IL 60609
Bridgeport NeighborhoodEstimated Value: $204,000 - $449,000
3
Beds
1
Bath
1,000
Sq Ft
$297/Sq Ft
Est. Value
About This Home
This home is located at 545 W 43rd Place, Chicago, IL 60609 and is currently estimated at $297,159, approximately $297 per square foot. 545 W 43rd Place is a home located in Cook County with nearby schools including Hendricks Elementary Community Academy, St Gabriel Elementary School, and Bridgeport Catholic Academy - South Campus.
Ownership History
Date
Name
Owned For
Owner Type
Purchase Details
Closed on
Jan 20, 2006
Sold by
Porucznik Michael J and Porucznik Catherine M
Bought by
Porucznik Catherine M
Current Estimated Value
Home Financials for this Owner
Home Financials are based on the most recent Mortgage that was taken out on this home.
Original Mortgage
$103,000
Interest Rate
6.2%
Mortgage Type
New Conventional
Purchase Details
Closed on
Jan 17, 2003
Sold by
Grow Irene Claudia
Bought by
Porucznik Michael J and Porucznik Catherine M
Home Financials for this Owner
Home Financials are based on the most recent Mortgage that was taken out on this home.
Original Mortgage
$123,900
Interest Rate
6.06%
Purchase Details
Closed on
Oct 26, 1995
Sold by
Dennis Edward M
Bought by
Grow Irene Claudia
Home Financials for this Owner
Home Financials are based on the most recent Mortgage that was taken out on this home.
Original Mortgage
$77,600
Interest Rate
7.65%
Create a Home Valuation Report for This Property
The Home Valuation Report is an in-depth analysis detailing your home's value as well as a comparison with similar homes in the area
Home Values in the Area
Average Home Value in this Area
Purchase History
| Date | Buyer | Sale Price | Title Company |
|---|---|---|---|
| Porucznik Catherine M | -- | Cti | |
| Porucznik Michael J | $155,000 | Pntn | |
| Grow Irene Claudia | $145,500 | -- |
Source: Public Records
Mortgage History
| Date | Status | Borrower | Loan Amount |
|---|---|---|---|
| Closed | Porucznik Catherine M | $103,000 | |
| Closed | Porucznik Michael J | $123,900 | |
| Previous Owner | Grow Irene Claudia | $77,600 | |
| Closed | Porucznik Michael J | $23,200 |
Source: Public Records
Tax History Compared to Growth
Tax History
| Year | Tax Paid | Tax Assessment Tax Assessment Total Assessment is a certain percentage of the fair market value that is determined by local assessors to be the total taxable value of land and additions on the property. | Land | Improvement |
|---|---|---|---|---|
| 2024 | $4,912 | $25,000 | $1,905 | $23,095 |
| 2023 | $4,767 | $26,595 | $3,175 | $23,420 |
| 2022 | $4,767 | $26,595 | $3,175 | $23,420 |
| 2021 | $5,162 | $29,000 | $3,175 | $25,825 |
| 2020 | $3,877 | $20,506 | $3,175 | $17,331 |
| 2019 | $3,889 | $22,785 | $3,175 | $19,610 |
| 2018 | $3,822 | $22,785 | $3,175 | $19,610 |
| 2017 | $3,445 | $19,378 | $2,857 | $16,521 |
| 2016 | $3,381 | $19,378 | $2,857 | $16,521 |
| 2015 | $3,070 | $19,378 | $2,857 | $16,521 |
| 2014 | $3,120 | $19,385 | $2,698 | $16,687 |
| 2013 | $3,047 | $19,385 | $2,698 | $16,687 |
Source: Public Records
Map
Nearby Homes
- 4407 S Wallace St
- 4411 S Wallace St
- 4419 S Wallace St
- 520 W 44th Place
- 604 W 43rd St
- 4425 S Union Ave
- 4217 S Emerald Ave
- 4353 S Halsted St
- 4452 S Shields Ave
- 4361 S Halsted St
- 4438 S Princeton Ave
- 3606 S Halsted St
- 613 W 46th Place
- 4451 S Princeton Ave
- 4555 S Halsted St
- 4243 S Princeton Ave
- 4904 S Princeton Ave
- 4158 S Wells St
- 4156 S Wells St
- 4204 S Wentworth Ave
- 543 W 43rd Place
- 549 W 43rd Place
- 541 W 43rd Place
- 551 W 43rd Place Unit 1
- 553 W 43rd Place
- 535 W 43rd Place Unit 1
- 555 W 43rd Place
- 559 W 43rd Place Unit 1
- 568 W 43rd Place
- 544 W 44th St
- 542 W 44th St
- 542 W 44th St
- 548 W 44th St
- 531 W 43rd Place
- 540 W 44th St
- 550 W 44th St
- 552 W 44th St
- 544 W 43rd Place
- 544 W 43rd Place Unit 2F
- 554 W 44th St