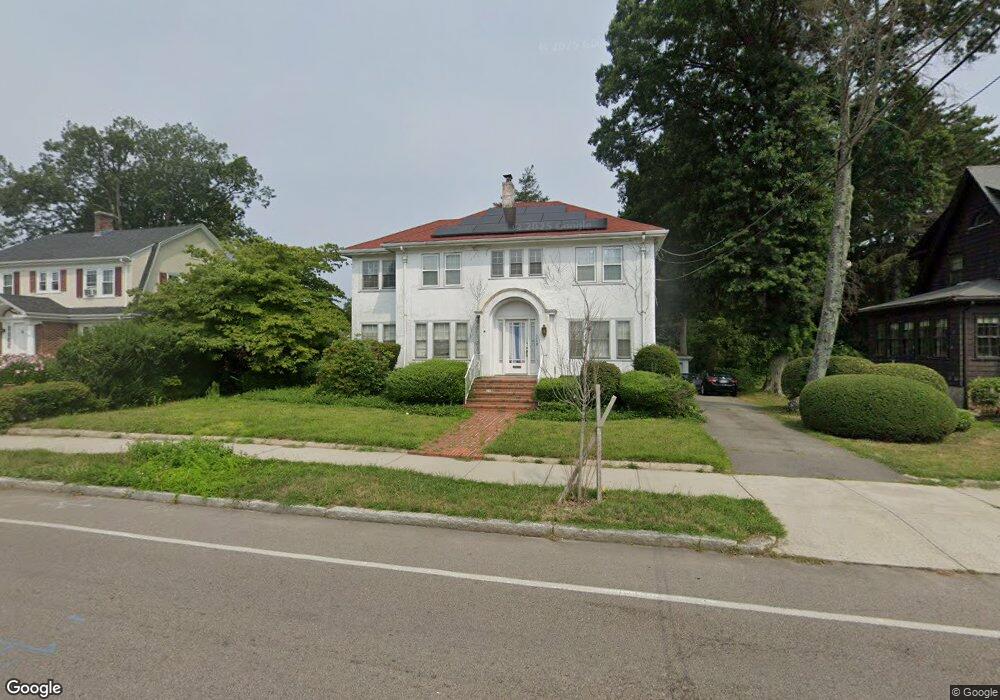
545 W Elm St Brockton, MA 02301
Estimated Value: $592,712 - $676,000
3
Beds
2
Baths
2,528
Sq Ft
$250/Sq Ft
Est. Value
About This Home
This home is located at 545 W Elm St, Brockton, MA 02301 and is currently estimated at $632,428, approximately $250 per square foot. 545 W Elm St is a home located in Plymouth County with nearby schools including Manthala George Jr. School, Hancock Elementary School, and Louis F Angelo Elementary School.
Ownership History
Date
Name
Owned For
Owner Type
Purchase Details
Closed on
Apr 9, 2012
Sold by
Pierre-Jerome Yves and Pierre-Jerome Lesly B
Bought by
545 West Elm Rt
Current Estimated Value
Purchase Details
Closed on
Jul 12, 2002
Sold by
Tasho Liria and Tasho James J
Bought by
Pierre-Jerome Yves and Pierre-Jerome Lesly B
Home Financials for this Owner
Home Financials are based on the most recent Mortgage that was taken out on this home.
Original Mortgage
$216,000
Interest Rate
6.79%
Mortgage Type
Purchase Money Mortgage
Purchase Details
Closed on
Nov 16, 1998
Sold by
Ahl Rt
Bought by
Fleischman Nt
Create a Home Valuation Report for This Property
The Home Valuation Report is an in-depth analysis detailing your home's value as well as a comparison with similar homes in the area
Home Values in the Area
Average Home Value in this Area
Purchase History
| Date | Buyer | Sale Price | Title Company |
|---|---|---|---|
| 545 West Elm Rt | -- | -- | |
| Pierre-Jerome Yves | $270,000 | -- | |
| Fleischman Nt | $85,000 | -- |
Source: Public Records
Mortgage History
| Date | Status | Borrower | Loan Amount |
|---|---|---|---|
| Previous Owner | Fleischman Nt | $100,000 | |
| Previous Owner | Fleischman Nt | $174,000 | |
| Previous Owner | Fleischman Nt | $216,000 |
Source: Public Records
Tax History Compared to Growth
Tax History
| Year | Tax Paid | Tax Assessment Tax Assessment Total Assessment is a certain percentage of the fair market value that is determined by local assessors to be the total taxable value of land and additions on the property. | Land | Improvement |
|---|---|---|---|---|
| 2025 | $6,327 | $522,500 | $148,700 | $373,800 |
| 2024 | $6,190 | $515,000 | $148,700 | $366,300 |
| 2023 | $6,223 | $479,400 | $113,900 | $365,500 |
| 2022 | $5,863 | $419,700 | $103,700 | $316,000 |
| 2021 | $5,401 | $372,500 | $97,300 | $275,200 |
| 2020 | $5,117 | $357,800 | $93,200 | $264,600 |
| 2019 | $5,009 | $318,900 | $87,400 | $231,500 |
| 2018 | $4,644 | $293,600 | $87,400 | $206,200 |
| 2017 | $4,460 | $273,500 | $87,400 | $186,100 |
| 2016 | $5,185 | $298,700 | $83,500 | $215,200 |
| 2015 | $5,100 | $281,000 | $83,500 | $197,500 |
| 2014 | $5,006 | $276,100 | $83,500 | $192,600 |
Source: Public Records
Map
Nearby Homes