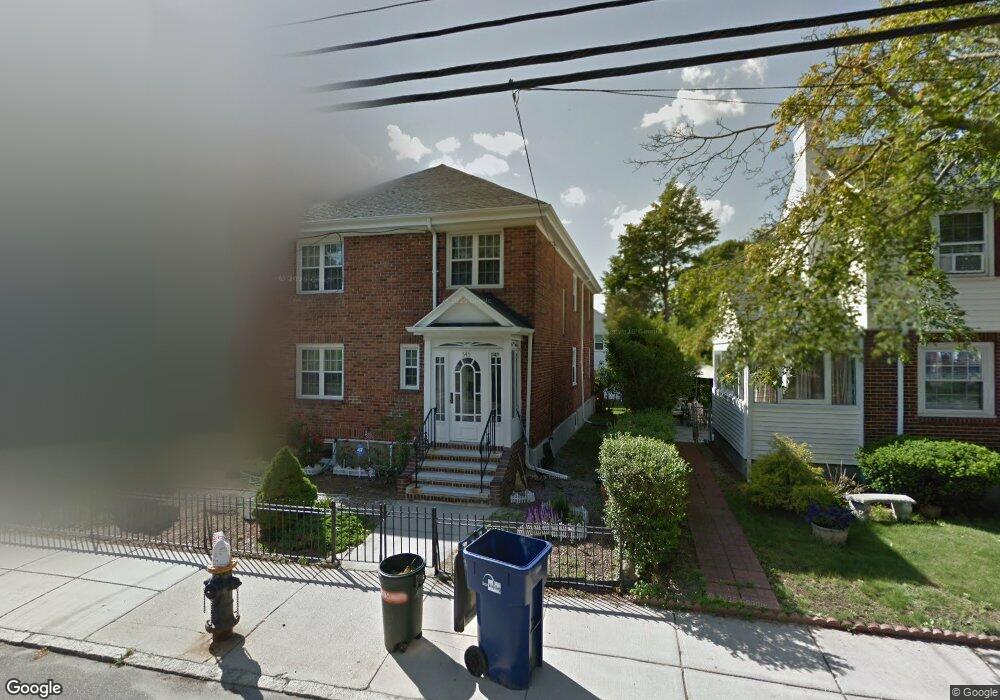
545 Weld St West Roxbury, MA 02132
West Roxbury NeighborhoodEstimated Value: $986,000 - $1,242,000
4
Beds
2
Baths
2,496
Sq Ft
$433/Sq Ft
Est. Value
About This Home
This home is located at 545 Weld St, West Roxbury, MA 02132 and is currently estimated at $1,081,979, approximately $433 per square foot. 545 Weld St is a home located in Suffolk County with nearby schools including Holy Name Parish School, St Theresa School, and The Roxbury Latin School.
Ownership History
Date
Name
Owned For
Owner Type
Purchase Details
Closed on
Feb 21, 2012
Sold by
Ana C Tapanes Ret
Bought by
Grosso Myriam B and Tapanes Ana C
Current Estimated Value
Home Financials for this Owner
Home Financials are based on the most recent Mortgage that was taken out on this home.
Original Mortgage
$98,200
Outstanding Balance
$11,935
Interest Rate
3.93%
Mortgage Type
New Conventional
Estimated Equity
$1,070,044
Purchase Details
Closed on
Jun 1, 2007
Sold by
Grosso Myriam B
Bought by
Myriam B Grosso Ret
Purchase Details
Closed on
May 29, 2007
Sold by
Tapanes Ana C
Bought by
Ana C Tapanes Ret
Purchase Details
Closed on
Oct 27, 1995
Sold by
Barron James A
Bought by
Tapanes Ana C and Grosso Myriam B
Home Financials for this Owner
Home Financials are based on the most recent Mortgage that was taken out on this home.
Original Mortgage
$199,500
Interest Rate
7.6%
Mortgage Type
Purchase Money Mortgage
Create a Home Valuation Report for This Property
The Home Valuation Report is an in-depth analysis detailing your home's value as well as a comparison with similar homes in the area
Home Values in the Area
Average Home Value in this Area
Purchase History
| Date | Buyer | Sale Price | Title Company |
|---|---|---|---|
| Grosso Myriam B | -- | -- | |
| Myriam B Grosso Ret | -- | -- | |
| Ana C Tapanes Ret | -- | -- | |
| Tapanes Ana C | $210,000 | -- |
Source: Public Records
Mortgage History
| Date | Status | Borrower | Loan Amount |
|---|---|---|---|
| Open | Grosso Myriam B | $98,200 | |
| Previous Owner | Tapanes Ana C | $204,000 | |
| Previous Owner | Tapanes Ana C | $200,000 | |
| Previous Owner | Tapanes Ana C | $199,500 |
Source: Public Records
Tax History Compared to Growth
Tax History
| Year | Tax Paid | Tax Assessment Tax Assessment Total Assessment is a certain percentage of the fair market value that is determined by local assessors to be the total taxable value of land and additions on the property. | Land | Improvement |
|---|---|---|---|---|
| 2025 | $10,739 | $927,400 | $305,900 | $621,500 |
| 2024 | $9,030 | $828,400 | $275,000 | $553,400 |
| 2023 | $8,813 | $820,600 | $272,400 | $548,200 |
| 2022 | $8,498 | $781,100 | $259,300 | $521,800 |
| 2021 | $7,646 | $716,600 | $237,900 | $478,700 |
| 2020 | $7,405 | $701,200 | $225,800 | $475,400 |
| 2019 | $6,972 | $661,500 | $170,800 | $490,700 |
| 2018 | $6,304 | $601,500 | $170,800 | $430,700 |
| 2017 | $6,011 | $567,600 | $170,800 | $396,800 |
| 2016 | $5,837 | $530,600 | $170,800 | $359,800 |
| 2015 | $6,248 | $515,900 | $178,400 | $337,500 |
| 2014 | $6,167 | $490,200 | $178,400 | $311,800 |
Source: Public Records
Map
Nearby Homes
- 168 Maple St
- 19 Pomfret St
- 37 Pomfret St
- 55 Redlands Rd
- 10 Burwell Rd
- 701 Vfw Pkwy
- 1789 Centre St Unit 202
- 37 Hastings St Unit 103
- 76 Vermont St
- 416 Belgrade Ave Unit 25
- 110 Park St Unit 3
- 170 Payson Rd
- 173 South St
- 22 Bellevue St
- 76 Potomac St
- 79 Potomac St
- 150 Tyndale St Unit 2
- 539 Lagrange St
- 72 Wallis Rd
- 311 Belgrade Ave
- 539 Weld St
- 11 Garnet Rd
- 555 Weld St
- 555 Weld St Unit 1
- 555 Weld St Unit 2
- 535 Weld St
- 535 Weld St Unit 2
- 14 Garnet Rd
- 17 Garnet Rd
- 559 Weld St
- 180 Manthorne Rd
- 180 Manthorne Rd Unit 1
- 176 Manthorne Rd Unit 2
- 176 Manthorne Rd Unit 1
- 176 Manthorne Rd Unit 176
- 546 Weld St
- 18 Garnet Rd
- 554 Weld St
- 182 Manthorne Rd Unit 184
- 182 Manthorne Rd Unit 1