Estimated Value: $234,270 - $278,000
2
Beds
1
Bath
978
Sq Ft
$259/Sq Ft
Est. Value
About This Home
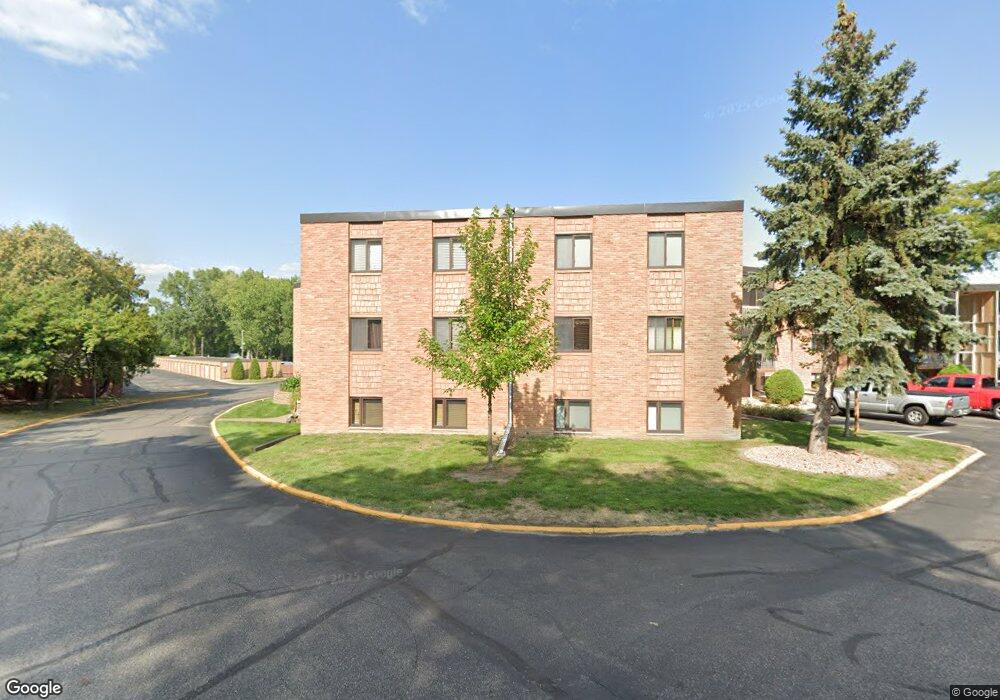
This home is located at 5450 Three Points Blvd Unit 616, Mound, MN 55364 and is currently estimated at $253,068, approximately $258 per square foot. 5450 Three Points Blvd Unit 616 is a home located in Hennepin County with nearby schools including Hilltop Primary School, Westonka Middle School, and Westonka High School.
Ownership History
Date
Name
Owned For
Owner Type
Purchase Details
Closed on
Jan 4, 2019
Sold by
Anderson Roger
Bought by
Johnson Steven D and Johnson Cindy L
Current Estimated Value
Home Financials for this Owner
Home Financials are based on the most recent Mortgage that was taken out on this home.
Original Mortgage
$161,405
Outstanding Balance
$142,201
Interest Rate
4.8%
Mortgage Type
New Conventional
Estimated Equity
$110,867
Purchase Details
Closed on
Jul 17, 2001
Sold by
Johnson Royal C
Bought by
Anderson Roger C and Anderson Sally L
Purchase Details
Closed on
Oct 17, 1996
Sold by
Dahl Lillian S
Bought by
Johnson Royal C
Create a Home Valuation Report for This Property
The Home Valuation Report is an in-depth analysis detailing your home's value as well as a comparison with similar homes in the area
Home Values in the Area
Average Home Value in this Area
Purchase History
| Date | Buyer | Sale Price | Title Company |
|---|---|---|---|
| Johnson Steven D | $169,900 | Burnet Title | |
| Anderson Roger C | $130,000 | -- | |
| Johnson Royal C | $70,000 | -- |
Source: Public Records
Mortgage History
| Date | Status | Borrower | Loan Amount |
|---|---|---|---|
| Open | Johnson Steven D | $161,405 |
Source: Public Records
Tax History Compared to Growth
Tax History
| Year | Tax Paid | Tax Assessment Tax Assessment Total Assessment is a certain percentage of the fair market value that is determined by local assessors to be the total taxable value of land and additions on the property. | Land | Improvement |
|---|---|---|---|---|
| 2024 | $2,164 | $220,100 | $70,500 | $149,600 |
| 2023 | $2,269 | $231,500 | $78,800 | $152,700 |
| 2022 | $1,800 | $202,000 | $58,000 | $144,000 |
| 2021 | $1,783 | $172,000 | $50,000 | $122,000 |
| 2020 | $1,698 | $170,000 | $45,000 | $125,000 |
| 2019 | $918 | $154,000 | $40,000 | $114,000 |
| 2018 | $685 | $85,000 | $32,000 | $53,000 |
| 2017 | $654 | $57,000 | $20,000 | $37,000 |
| 2016 | $693 | $57,000 | $20,000 | $37,000 |
| 2015 | $604 | $68,000 | $22,000 | $46,000 |
| 2014 | -- | $49,000 | $18,000 | $31,000 |
Source: Public Records
Map
Nearby Homes
- 5440 Three Points Blvd Unit 513
- 5440 Three Points Blvd Unit 523
- 5440 Three Points Blvd Unit 525
- 5440 Three Points Blvd Unit 536
- 5450 Three Points Blvd Unit 623
- 5430 Three Points Blvd Unit 131
- 5400 Three Points Blvd Unit 335
- 1571 Bluebird Ln
- 5118 Three Points Blvd
- 5760 Village Trail
- 5735 Village Trail Unit 5735
- 4945 Glen Elyn Rd
- 1736 Shorewood Ln
- 2350 Harbor Place Unit 214
- 5457 Lost Lake Ln
- 5441 Lost Lake Ln
- 2209 Chateau Ln
- 5080 Minneapolis Ave
- 1045 Crest Ridge Ct
- 2156 Sandy Ln
- 5450 Three Points Blvd Unit 621
- 5450 Three Points Blvd Unit 636
- 5450 Three Points Blvd Unit 635
- 5450 Three Points Blvd Unit 634
- 5450 Three Points Blvd Unit 632
- 5450 Three Points Blvd Unit 631
- 5450 Three Points Blvd Unit 626
- 5450 Three Points Blvd Unit 625
- 5450 Three Points Blvd Unit 624
- 5450 Three Points Blvd Unit 623
- 5450 Three Points Blvd Unit 622
- 5450 Three Points Blvd Unit 621
- 5450 Three Points Blvd Unit 615
- 5450 Three Points Blvd Unit 614
- 5450 Three Points Blvd Unit 613
- 5450 Three Points Blvd Unit 611
- 5450 Three Points Blvd Unit 42G
- 5450 Three Points Blvd Unit 14G
- 5450 Three Points Blvd
- 5450 Three Points Blvd Unit 636