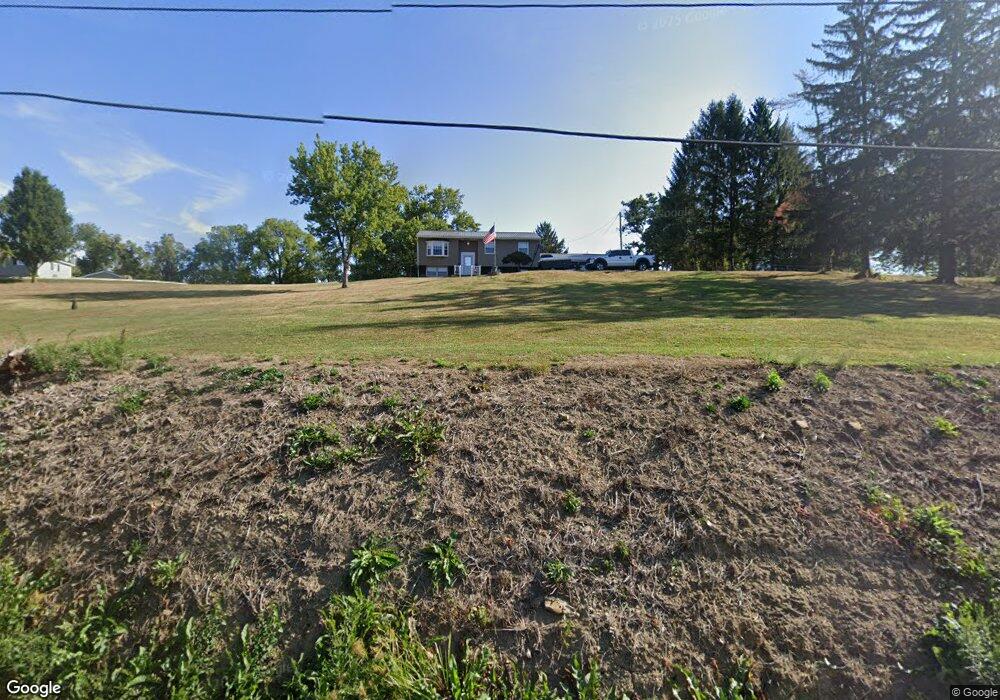
54519 Sunny Acres Bellaire, OH 43906
Estimated Value: $190,000 - $257,000
3
Beds
2
Baths
1,204
Sq Ft
$177/Sq Ft
Est. Value
About This Home
This home is located at 54519 Sunny Acres, Bellaire, OH 43906 and is currently estimated at $213,046, approximately $176 per square foot. 54519 Sunny Acres is a home located in Belmont County with nearby schools including Bellaire Elementary School, Bellaire Middle School, and Bellaire High School.
Ownership History
Date
Name
Owned For
Owner Type
Purchase Details
Closed on
Jan 31, 2012
Sold by
Marinelli William J and Marinelli Pamela J
Bought by
Frazier Seth M
Current Estimated Value
Home Financials for this Owner
Home Financials are based on the most recent Mortgage that was taken out on this home.
Original Mortgage
$112,084
Outstanding Balance
$78,101
Interest Rate
4.25%
Mortgage Type
FHA
Estimated Equity
$134,945
Purchase Details
Closed on
Oct 25, 2004
Sold by
Marinelli William J and Marinelli Pam
Bought by
Marinelli William J and Pamela Jsurv
Purchase Details
Closed on
Dec 4, 2002
Sold by
Klempa Jeremy and Klempa Cheryle S
Bought by
Klempa Jeremy and Klempa Cheryle S
Purchase Details
Closed on
Feb 21, 1995
Sold by
Farnario Gerald A
Bought by
Farnario Gerald A
Purchase Details
Closed on
Jan 1, 1986
Sold by
Farnario Gerald A and Farnario Kathr
Bought by
Farnario Gerald A and Farnario Kathr
Create a Home Valuation Report for This Property
The Home Valuation Report is an in-depth analysis detailing your home's value as well as a comparison with similar homes in the area
Home Values in the Area
Average Home Value in this Area
Purchase History
| Date | Buyer | Sale Price | Title Company |
|---|---|---|---|
| Frazier Seth M | $115,000 | Attorney | |
| Marinelli William J | $116,000 | -- | |
| Klempa Jeremy | $111,000 | -- | |
| Farnario Gerald A | $2,500 | -- | |
| Farnario Gerald A | -- | -- |
Source: Public Records
Mortgage History
| Date | Status | Borrower | Loan Amount |
|---|---|---|---|
| Open | Frazier Seth M | $112,084 |
Source: Public Records
Tax History Compared to Growth
Tax History
| Year | Tax Paid | Tax Assessment Tax Assessment Total Assessment is a certain percentage of the fair market value that is determined by local assessors to be the total taxable value of land and additions on the property. | Land | Improvement |
|---|---|---|---|---|
| 2024 | $1,570 | $53,680 | $6,490 | $47,190 |
| 2023 | $1,669 | $42,060 | $6,010 | $36,050 |
| 2022 | $1,670 | $42,056 | $6,010 | $36,046 |
| 2021 | $1,665 | $42,063 | $6,013 | $36,050 |
| 2020 | $1,519 | $36,600 | $5,230 | $31,370 |
| 2019 | $1,520 | $36,600 | $5,230 | $31,370 |
| 2018 | $1,510 | $36,600 | $5,230 | $31,370 |
| 2017 | $1,534 | $37,700 | $4,220 | $33,480 |
| 2016 | $1,576 | $38,720 | $4,220 | $34,500 |
| 2015 | $1,622 | $39,330 | $4,220 | $35,110 |
| 2014 | $1,518 | $36,350 | $3,840 | $32,510 |
| 2013 | $1,371 | $36,350 | $3,840 | $32,510 |
Source: Public Records
Map
Nearby Homes
- 54420 Key Bellaire Rd
- 55201 New Cut Rd
- 0 Fulton Hill Rd (Cr 42) Unit 5129179
- 55584 Bel Haven
- 0 Sand Hill Rd
- 56068 Key Bellaire Rd
- 55794 Bel Haven
- 55899 Poplar Dr
- 61060 Webb Heights Rd
- 56260 Key Bellaire Rd
- 56929 Winding Hill Rd
- 54040 Pike St
- 1020 Maple Ave
- 2364 W 23rd St
- 56612 McGee Rd
- 3927 Daisyview St
- 439 W 45th St
- 473 W 39th St
- 51737 Key Bellaire Rd
- 1257 Maple Ave
- 54535 Sunny Acres
- 54505 Sunny Acres
- 54480 Key Bellaire Rd
- 54502 Sunny Acres
- 54540 Sunny Acres
- 54470 Key Bellaire Rd
- 54530 Winding Hill Rd
- 54576 Sunny Acres
- 54576 Key Bellaire Rd
- 54406 Key Bellaire Rd
- 54618 Sunny Acres
- 54667 Sunny Acres
- 54390 Key Bellaire Rd
- 54560 Winding Hill Rd
- 54642 Sunny Acres
- 54378 Key Bellaire Rd
- 54590 Winding Hill Rd
- 54673 Sunny Acres
- 54664 Sunny Acres
- 54558 Winding Hill Rd