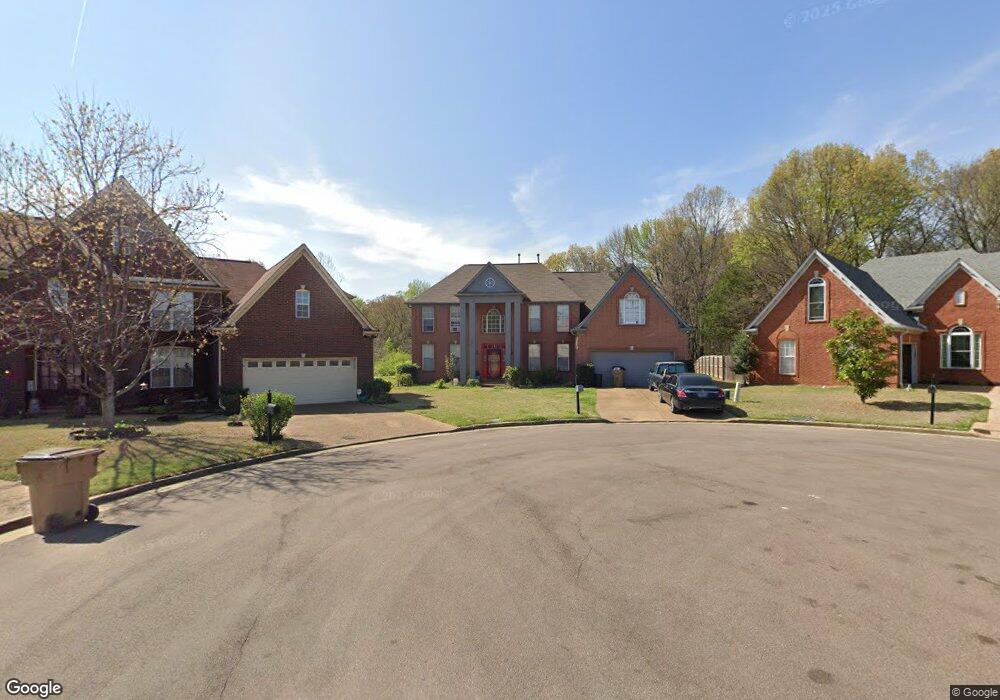
5453 Bridge Meadow Cove Memphis, TN 38125
Southern Shelby County NeighborhoodEstimated Value: $350,000 - $383,000
4
Beds
3
Baths
3,651
Sq Ft
$99/Sq Ft
Est. Value
About This Home
This home is located at 5453 Bridge Meadow Cove, Memphis, TN 38125 and is currently estimated at $363,157, approximately $99 per square foot. 5453 Bridge Meadow Cove is a home located in Shelby County with nearby schools including Highland Oaks Elementary School, Highland Oaks Middle School, and Southwind High School.
Ownership History
Date
Name
Owned For
Owner Type
Purchase Details
Closed on
Apr 5, 2007
Sold by
Hsbc Bank Usa
Bought by
Evans George B and Evans Patricia A
Current Estimated Value
Home Financials for this Owner
Home Financials are based on the most recent Mortgage that was taken out on this home.
Original Mortgage
$186,000
Outstanding Balance
$112,461
Interest Rate
6.15%
Mortgage Type
Purchase Money Mortgage
Estimated Equity
$250,696
Purchase Details
Closed on
Nov 7, 2006
Sold by
Cobb Ray E and Cobb Tangela
Bought by
Hsbc Bank Usa Na
Purchase Details
Closed on
Dec 15, 2003
Sold by
Mark Matthews Development Llc
Bought by
Cobb Ray E
Home Financials for this Owner
Home Financials are based on the most recent Mortgage that was taken out on this home.
Original Mortgage
$190,745
Interest Rate
7.05%
Mortgage Type
Purchase Money Mortgage
Purchase Details
Closed on
Feb 11, 2003
Sold by
R & R Land Development Co Llc
Bought by
Mark Matthews Development Llc
Create a Home Valuation Report for This Property
The Home Valuation Report is an in-depth analysis detailing your home's value as well as a comparison with similar homes in the area
Home Values in the Area
Average Home Value in this Area
Purchase History
| Date | Buyer | Sale Price | Title Company |
|---|---|---|---|
| Evans George B | $186,000 | Edco Title & Closing Service | |
| Hsbc Bank Usa Na | $205,146 | None Available | |
| Cobb Ray E | $238,431 | -- | |
| Mark Matthews Development Llc | $340,000 | Chicago Title |
Source: Public Records
Mortgage History
| Date | Status | Borrower | Loan Amount |
|---|---|---|---|
| Open | Evans George B | $186,000 | |
| Previous Owner | Cobb Ray E | $190,745 | |
| Closed | Cobb Ray E | $47,686 |
Source: Public Records
Tax History Compared to Growth
Tax History
| Year | Tax Paid | Tax Assessment Tax Assessment Total Assessment is a certain percentage of the fair market value that is determined by local assessors to be the total taxable value of land and additions on the property. | Land | Improvement |
|---|---|---|---|---|
| 2025 | $2,324 | $90,425 | $14,000 | $76,425 |
| 2024 | $2,324 | $68,550 | $8,750 | $59,800 |
| 2023 | $2,324 | $68,550 | $8,750 | $59,800 |
| 2022 | $2,324 | $68,550 | $8,750 | $59,800 |
| 2021 | $2,365 | $68,550 | $8,750 | $59,800 |
| 2020 | $2,091 | $51,625 | $8,750 | $42,875 |
| 2019 | $2,091 | $51,625 | $8,750 | $42,875 |
| 2018 | $2,091 | $51,625 | $8,750 | $42,875 |
| 2017 | $2,122 | $51,625 | $8,750 | $42,875 |
| 2016 | $1,738 | $39,775 | $0 | $0 |
| 2014 | $1,738 | $39,775 | $0 | $0 |
Source: Public Records
Map
Nearby Homes
- 7129 Brook Mill Cove
- 7206 State Line Rd
- 6400 State Line Rd
- 5178 Autumn Morning Cove
- 9444 Geneva Loop E
- 5252 Lake Village Dr
- 5583 Liberty Ridge Cove
- 5517 Harvey Hill Dr
- 5563 Annandale Dr
- 5084 Autumn Morning Ln
- 5100 Sunny Autumn Ln
- 9164 Superior Cove
- 6696 Autumn Wood Cove
- 5324 Annandale Dr Unit 5324 Annandale Dr TN
- 5265 Annandale Dr
- 6770 Shoreline Cir
- 9387 Joe Lyon Blvd
- 7125 Farmhouse Dr
- 6744 Shoreline Cir
- 6716 Shoreline Cir
- 5457 Bridge Meadow Cove
- 5461 Bridge Meadow Cove
- 5441 Bridge Meadow Cove
- 5465 Bridge Meadow Cove
- 5440 Bridge Meadow Cove
- 5475 Bridge Meadow Cove
- 5475 Walton Hill Dr
- 5446 Bridge Meadow Cove
- 5466 Bridge Meadow Cove
- 5481 Walton Hill Dr
- 7072 Bristol Meadow Ln
- 5450 Bridge Meadow Cove
- 5454 Bridge Meadow Cove
- 5465 Walton Hill Dr
- 7078 Bristol Meadow Ln
- 5446 Riverdale Rd
- 7071 Bristol Meadow Ln
- 7048 Fernbank Ln
- 7040 Fernbank Ln
- 7032 Fernbank Ln