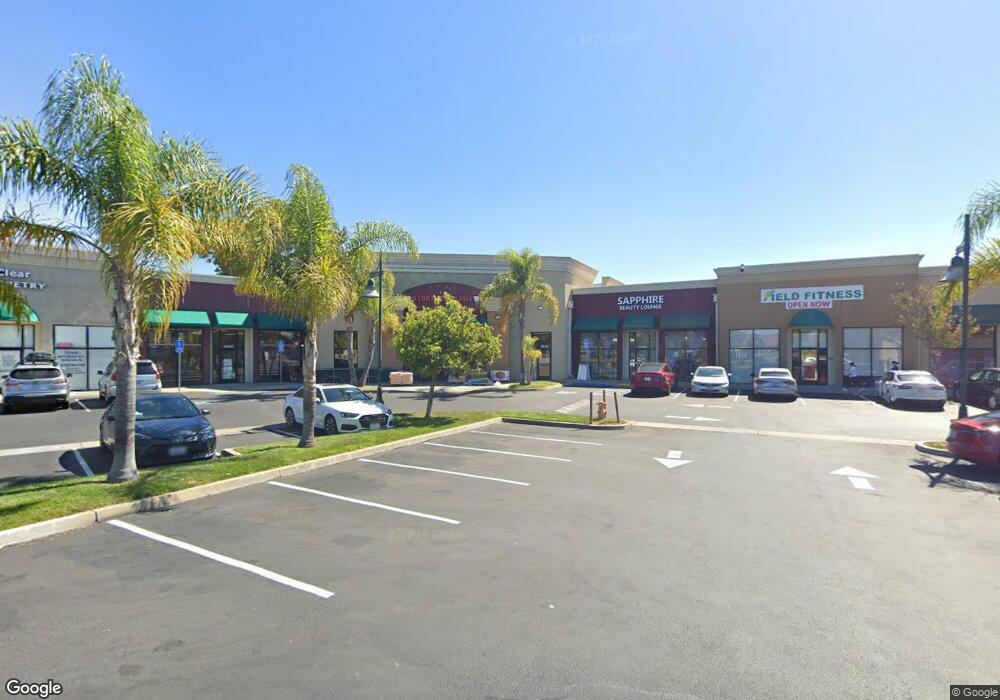
5454 Central Ave Newark, CA 94560
Birch Grove NeighborhoodEstimated Value: $12,241,097
Studio
--
Bath
274,200
Sq Ft
$45/Sq Ft
Est. Value
About This Home
This home is located at 5454 Central Ave, Newark, CA 94560 and is currently estimated at $12,241,097, approximately $44 per square foot. 5454 Central Ave is a home located in Alameda County with nearby schools including Birch Grove Intermediate School, Newark Junior High School, and Newark Memorial High School.
Ownership History
Date
Name
Owned For
Owner Type
Purchase Details
Closed on
Dec 5, 2019
Sold by
Spaulding Jordan J and Spaulding Heather Hsiao
Bought by
Leaning Cedar Llc
Current Estimated Value
Home Financials for this Owner
Home Financials are based on the most recent Mortgage that was taken out on this home.
Original Mortgage
$5,200,000
Interest Rate
3.6%
Mortgage Type
Commercial
Purchase Details
Closed on
May 20, 2005
Sold by
Spinnaker Properties Llc
Bought by
Rounda Sheng Steven Nin Chun and Rounda Sheng
Purchase Details
Closed on
Jun 21, 2001
Sold by
Spinola William M and Locatelli John L
Bought by
Spinnaker Properties Llc
Home Financials for this Owner
Home Financials are based on the most recent Mortgage that was taken out on this home.
Original Mortgage
$1,000,000
Interest Rate
7.14%
Mortgage Type
Commercial
Create a Home Valuation Report for This Property
The Home Valuation Report is an in-depth analysis detailing your home's value as well as a comparison with similar homes in the area
Home Values in the Area
Average Home Value in this Area
Purchase History
| Date | Buyer | Sale Price | Title Company |
|---|---|---|---|
| Leaning Cedar Llc | -- | Chicago Title Company | |
| Spaulding Jordan J | $8,600,000 | Chicago Title Company | |
| Rounda Sheng Steven Nin Chun | -- | Chicago Title Co | |
| Spinnaker Properties Llc | $2,100,000 | American Title Co |
Source: Public Records
Mortgage History
| Date | Status | Borrower | Loan Amount |
|---|---|---|---|
| Previous Owner | Spaulding Jordan J | $5,200,000 | |
| Previous Owner | Spinnaker Properties Llc | $1,000,000 |
Source: Public Records
Tax History
| Year | Tax Paid | Tax Assessment Tax Assessment Total Assessment is a certain percentage of the fair market value that is determined by local assessors to be the total taxable value of land and additions on the property. | Land | Improvement |
|---|---|---|---|---|
| 2025 | $121,179 | $9,405,218 | $2,734,075 | $6,671,143 |
| 2024 | $121,179 | $9,220,834 | $2,680,475 | $6,540,359 |
| 2023 | $115,567 | $9,040,062 | $2,627,925 | $6,412,137 |
| 2022 | $114,177 | $8,862,816 | $2,576,400 | $6,286,416 |
| 2021 | $115,989 | $8,689,096 | $2,525,900 | $6,163,196 |
| 2020 | $115,470 | $8,600,000 | $2,500,000 | $6,100,000 |
| 2019 | $93,819 | $7,033,294 | $3,436,070 | $3,597,224 |
| 2018 | $89,314 | $6,642,178 | $3,368,722 | $3,273,456 |
| 2017 | $82,095 | $6,414,035 | $3,302,695 | $3,111,340 |
| 2016 | $82,197 | $6,219,311 | $3,237,960 | $2,981,351 |
| 2015 | $79,260 | $6,125,931 | $3,189,340 | $2,936,591 |
| 2014 | $75,882 | $5,685,973 | $3,126,887 | $2,559,086 |
Source: Public Records
Map
Nearby Homes
- 5268 Keeler Ct
- 5229 Sabin Ave
- 38445 Amaranto St
- 37141 Saint Christopher St
- 38463 Amaranto St
- 38509 Amaranto St
- 38515 Amaranto St
- 38539 Amaranto St
- 5513 Higo Way
- 5550 Higo Way
- 6257 Honeysuckle Dr
- 5502 Higo Way
- 5516 Higo Way
- 37640 Hyacinth St
- 4845 Los Arboles Place
- 38427 Cedar Blvd
- 6241 Cotton Ave
- 37226 Dutra Way
- 6364 Honeysuckle Dr
- 5912 Mayhews Landing Rd
- 5438 Central Ave
- 5486 Central Ave
- 37660 Timber St
- 5498 Central Ave
- 37735 Granville Dr
- 37747 Granville Dr
- 37723 Granville Dr
- 37759 Granville Dr
- 37711 Granville Dr
- 37643 Timber St
- 37771 Granville Dr
- 37659 Granville Dr
- 5409 Central Ave
- 37783 Granville Dr
- 37780 Taro Terrace
- 37798 Taro Terrace
- 37782 Taro Terrace
- 37647 Granville Dr
- 37776 Taro Terrace
- 37790 Taro Terrace
Your Personal Tour Guide
Ask me questions while you tour the home.