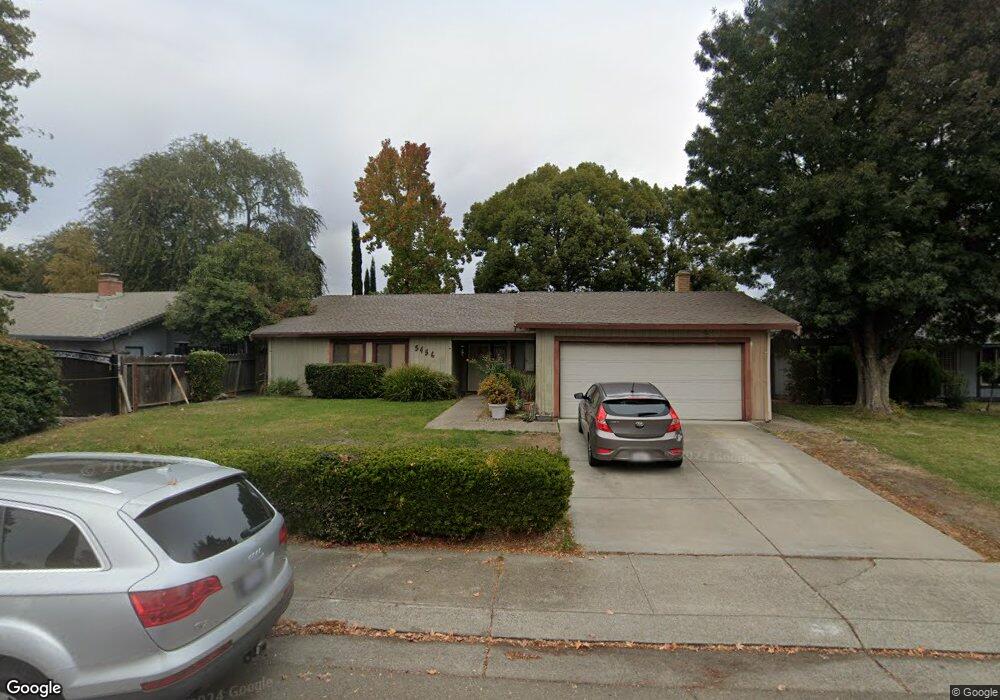
5456 Passero Way Stockton, CA 95207
Lincoln Village NeighborhoodEstimated Value: $449,000 - $515,000
3
Beds
2
Baths
1,753
Sq Ft
$269/Sq Ft
Est. Value
About This Home
This home is located at 5456 Passero Way, Stockton, CA 95207 and is currently estimated at $471,391, approximately $268 per square foot. 5456 Passero Way is a home located in San Joaquin County with nearby schools including Flora Arca Mata, Madison Elementary School, and Hoover Elementary School.
Ownership History
Date
Name
Owned For
Owner Type
Purchase Details
Closed on
Nov 4, 2010
Sold by
Nicholas Cheever Martha and The Sam & Maxine Nicholas Fami
Bought by
Dillard Bill Henry
Current Estimated Value
Home Financials for this Owner
Home Financials are based on the most recent Mortgage that was taken out on this home.
Original Mortgage
$158,720
Outstanding Balance
$105,041
Interest Rate
4.33%
Mortgage Type
VA
Estimated Equity
$366,350
Purchase Details
Closed on
Nov 3, 2010
Sold by
Dillard Lynette Diane
Bought by
Dillard Bill Henry
Home Financials for this Owner
Home Financials are based on the most recent Mortgage that was taken out on this home.
Original Mortgage
$158,720
Outstanding Balance
$105,041
Interest Rate
4.33%
Mortgage Type
VA
Estimated Equity
$366,350
Purchase Details
Closed on
Feb 11, 2005
Sold by
Nicholas Mildred Maxine and The Sam & Maxine Nicholas Fami
Bought by
Seefried Erica and Seefried Nicholas Cheever
Create a Home Valuation Report for This Property
The Home Valuation Report is an in-depth analysis detailing your home's value as well as a comparison with similar homes in the area
Home Values in the Area
Average Home Value in this Area
Purchase History
| Date | Buyer | Sale Price | Title Company |
|---|---|---|---|
| Dillard Bill Henry | $149,000 | Old Republic Title Company | |
| Dillard Bill Henry | -- | Old Republic Title Company | |
| Seefried Erica | -- | -- |
Source: Public Records
Mortgage History
| Date | Status | Borrower | Loan Amount |
|---|---|---|---|
| Open | Dillard Bill Henry | $158,720 |
Source: Public Records
Tax History Compared to Growth
Tax History
| Year | Tax Paid | Tax Assessment Tax Assessment Total Assessment is a certain percentage of the fair market value that is determined by local assessors to be the total taxable value of land and additions on the property. | Land | Improvement |
|---|---|---|---|---|
| 2025 | $7,570 | $190,883 | $44,836 | $146,047 |
| 2024 | $3,187 | $187,141 | $43,957 | $143,184 |
| 2023 | $2,327 | $183,473 | $43,096 | $140,377 |
| 2022 | $2,252 | $179,876 | $42,251 | $137,625 |
| 2021 | $2,164 | $176,350 | $41,423 | $134,927 |
| 2020 | $2,206 | $174,543 | $40,999 | $133,544 |
| 2019 | $2,197 | $171,122 | $40,196 | $130,926 |
| 2018 | $2,156 | $167,767 | $39,408 | $128,359 |
| 2017 | $2,043 | $164,479 | $38,636 | $125,843 |
| 2016 | $2,081 | $161,256 | $37,879 | $123,377 |
| 2014 | $1,979 | $155,723 | $36,579 | $119,144 |
Source: Public Records
Map
Nearby Homes
- 1834 Venetian Dr
- 5618 Cascade Ct
- 1902 Venetian Dr
- 2034 Venetian Dr
- 1443 San Rocco Cir
- 2005 Cedar Ridge Dr
- 2009 Cedar Ridge Dr
- 5215 Grouse Run Dr
- 5330 Covey Creek Cir
- 1548 Griffin Point
- 4985 Gadwall Cir
- 1929 W Swain Rd
- 2128 Canyon Creek Dr
- 5021 Gadwall Cir
- 1707 W Swain Rd Unit 5
- 1947 Rosecrans Way
- 2329 Lido Cir
- 2433 Pheasant Run Cir
- 1417 W Swain Rd
- 2252 Canyon Creek Dr
- 5444 Passero Way
- 5504 Passero Way
- 1723 Veronese Way
- 1786 Long Barn Way
- 1715 Veronese Way
- 5455 Passero Way
- 1778 Long Barn Way
- 1794 Long Barn Way
- 5441 Passero Way
- 1770 Long Barn Way
- 1788 Long Barn Way
- 1801 San Simeone Way
- 5418 Passero Way
- 1720 Veronese Way
- 1796 Long Barn Way
- 5433 Passero Way
- 1707 Veronese Way
- 1762 Long Barn Way
- 1807 San Simeone Way
- 1808 San Simeone Way