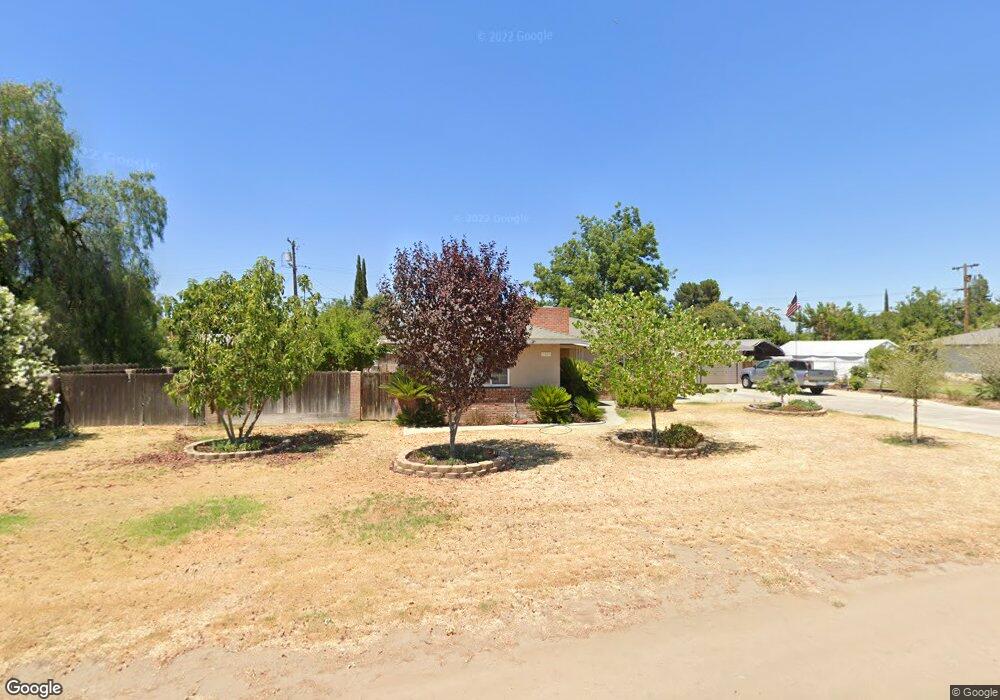
5457 E Lansing Way Fresno, CA 93727
Tarpey NeighborhoodEstimated Value: $195,000 - $343,000
3
Beds
2
Baths
1,434
Sq Ft
$207/Sq Ft
Est. Value
About This Home
This home is located at 5457 E Lansing Way, Fresno, CA 93727 and is currently estimated at $296,812, approximately $206 per square foot. 5457 E Lansing Way is a home located in Fresno County with nearby schools including Tarpey Elementary School, Alta Sierra Intermediate School, and Buchanan High School.
Ownership History
Date
Name
Owned For
Owner Type
Purchase Details
Closed on
May 3, 2023
Sold by
Phillips Leman L and Phillips Arbia L
Bought by
Leman L Phillips And Arbia L Phillips Revocab and Phillips
Current Estimated Value
Purchase Details
Closed on
May 1, 2023
Sold by
Phillips Leman L and Phillips Arbia L
Bought by
Leman L Phillips And Arbia L Phillips Revocab
Purchase Details
Closed on
Oct 21, 1997
Sold by
Gregory Nellie P
Bought by
Phillips Leman L and Phillips Arbia L
Home Financials for this Owner
Home Financials are based on the most recent Mortgage that was taken out on this home.
Original Mortgage
$78,000
Interest Rate
7.3%
Purchase Details
Closed on
Jun 17, 1996
Sold by
Gregory Nellie P
Bought by
Gregory Nellie P
Create a Home Valuation Report for This Property
The Home Valuation Report is an in-depth analysis detailing your home's value as well as a comparison with similar homes in the area
Home Values in the Area
Average Home Value in this Area
Purchase History
| Date | Buyer | Sale Price | Title Company |
|---|---|---|---|
| Leman L Phillips And Arbia L Phillips Revocab | -- | None Listed On Document | |
| Leman L Phillips And Arbia L Phillips Revocab | -- | None Listed On Document | |
| Phillips Leman L | $97,500 | Fidelity National Title Co | |
| Gregory Nellie P | -- | -- |
Source: Public Records
Mortgage History
| Date | Status | Borrower | Loan Amount |
|---|---|---|---|
| Previous Owner | Phillips Leman L | $78,000 |
Source: Public Records
Tax History Compared to Growth
Tax History
| Year | Tax Paid | Tax Assessment Tax Assessment Total Assessment is a certain percentage of the fair market value that is determined by local assessors to be the total taxable value of land and additions on the property. | Land | Improvement |
|---|---|---|---|---|
| 2025 | $1,768 | $155,653 | $47,884 | $107,769 |
| 2023 | $1,698 | $149,611 | $46,026 | $103,585 |
| 2022 | $1,674 | $146,678 | $45,124 | $101,554 |
| 2021 | $1,626 | $143,803 | $44,240 | $99,563 |
| 2020 | $1,619 | $142,330 | $43,787 | $98,543 |
| 2019 | $1,586 | $139,540 | $42,929 | $96,611 |
| 2018 | $1,550 | $136,805 | $42,088 | $94,717 |
| 2017 | $1,522 | $134,123 | $41,263 | $92,860 |
| 2016 | $1,470 | $131,494 | $40,454 | $91,040 |
| 2015 | $1,446 | $129,520 | $39,847 | $89,673 |
| 2014 | $1,418 | $126,984 | $39,067 | $87,917 |
Source: Public Records
Map
Nearby Homes
- 3605 Phillip Ave
- 5588 E National Ave
- 4065 N Eddy Ave
- 5675 E Ashlan Ave
- 5703 E Hampton Way
- 3734 Manila Ave
- 91 W Richert Ave
- 5658 E Bernadine Dr
- 5739 E Hampton Way
- 371 W Swift Ave
- 3556 N Duke Ave Unit 165
- 5164 E Ashlan Ave Unit 131
- 5138 E Ashlan Ave Unit 101
- 5138 E Ashlan Ave Unit 106
- 521 W Ashlan Ave
- 531 W Ashlan Ave
- 541 W Ashlan Ave
- 3550 N Duke Ave Unit 37
- 3550 N Duke Ave Unit 10
- 3550 N Duke Ave Unit 12
- 5469 E Lansing Way
- 5447 E Lansing Way
- 5456 E Saginaw Way
- 5444 E Saginaw Way
- 5458 E Lansing Way
- 5468 E Saginaw Way
- 5448 E Lansing Way
- 5473 E Lansing Way
- 5439 E Lansing Way
- 5438 E Saginaw Way
- 5440 E Lansing Way
- 5461 E Dakota Ave
- 5459 E Saginaw Way
- 5476 E Saginaw Way
- 5474 E Lansing Way
- 5451 E Dakota Ave
- 5451 E Saginaw Way
- 5471 E Dakota Ave
- 5467 E Saginaw Way
- 5434 E Saginaw Way