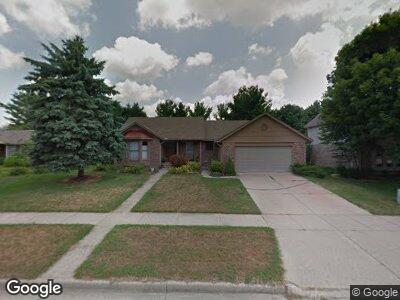
5458 Jo Pass East Lansing, MI 48823
Estimated Value: $331,000 - $371,000
3
Beds
2
Baths
1,680
Sq Ft
$210/Sq Ft
Est. Value
About This Home
This home is located at 5458 Jo Pass, East Lansing, MI 48823 and is currently estimated at $352,142, approximately $209 per square foot. 5458 Jo Pass is a home located in Ingham County with nearby schools including Bennett Woods Elementary School, Kinawa School, and Chippewa Middle School.
Ownership History
Date
Name
Owned For
Owner Type
Purchase Details
Closed on
Jul 20, 1998
Sold by
The Jeff Y and Lee Sung Hee
Bought by
Ruthenberg Stephen John
Current Estimated Value
Purchase Details
Closed on
Mar 15, 1996
Sold by
Du Qiang and Chiu Chichia
Bought by
The Jeff Y and Lee Sung Hee
Purchase Details
Closed on
Oct 1, 1991
Bought by
Du
Purchase Details
Closed on
Sep 1, 1988
Bought by
Hancock
Purchase Details
Closed on
Feb 1, 1988
Bought by
Suburban Homes
Create a Home Valuation Report for This Property
The Home Valuation Report is an in-depth analysis detailing your home's value as well as a comparison with similar homes in the area
Home Values in the Area
Average Home Value in this Area
Purchase History
| Date | Buyer | Sale Price | Title Company |
|---|---|---|---|
| Ruthenberg Stephen John | $164,000 | -- | |
| The Jeff Y | $156,000 | -- | |
| Du | $139,000 | -- | |
| Hancock | $135,000 | -- | |
| Suburban Homes | $33,200 | -- |
Source: Public Records
Mortgage History
| Date | Status | Borrower | Loan Amount |
|---|---|---|---|
| Closed | Ruthenberg Stephen J | $18,600 | |
| Open | Ruthenberg Stephen John | $43,900 |
Source: Public Records
Tax History Compared to Growth
Tax History
| Year | Tax Paid | Tax Assessment Tax Assessment Total Assessment is a certain percentage of the fair market value that is determined by local assessors to be the total taxable value of land and additions on the property. | Land | Improvement |
|---|---|---|---|---|
| 2024 | $5,787 | $149,800 | $27,200 | $122,600 |
| 2023 | $5,787 | $143,000 | $27,600 | $115,400 |
| 2022 | $5,510 | $136,300 | $26,400 | $109,900 |
| 2021 | $5,395 | $124,600 | $23,300 | $101,300 |
| 2020 | $5,308 | $118,700 | $23,300 | $95,400 |
| 2019 | $5,128 | $117,200 | $23,500 | $93,700 |
| 2018 | $4,861 | $108,000 | $16,600 | $91,400 |
| 2017 | $4,646 | $101,000 | $16,800 | $84,200 |
| 2016 | $2,071 | $104,800 | $17,500 | $87,300 |
| 2015 | $2,071 | $103,700 | $34,631 | $69,069 |
| 2014 | $2,071 | $92,500 | $31,131 | $61,369 |
Source: Public Records
Map
Nearby Homes
- 5331 E Hidden Lake Dr
- 2410 Burcham Dr
- 2371 Emerald Forest Cir
- 2411 Emerald Lake Dr
- 2343 Sapphire Ln Unit 48
- 2430 Emerald Lake Dr
- 2397 Emerald Forest Cir Unit 26
- 5267 E Hidden Lake Dr
- 2440 Emerald Lake Dr
- 2454 Emerald Lake Dr Unit 106
- 5431 Wild Oak Dr Unit 20
- 5259 Golden Cir
- 2229 Cider Mill Dr Unit 124
- 2046 Blue Lac Dr Unit 73
- 2042 Blue Lac Dr Unit 75
- 5568 Wild Iris Ln
- 2512 Royce Ct
- 5791 Westminster Way
- 5680 Deville Ct Unit 61
- 5380 Blue Haven Dr