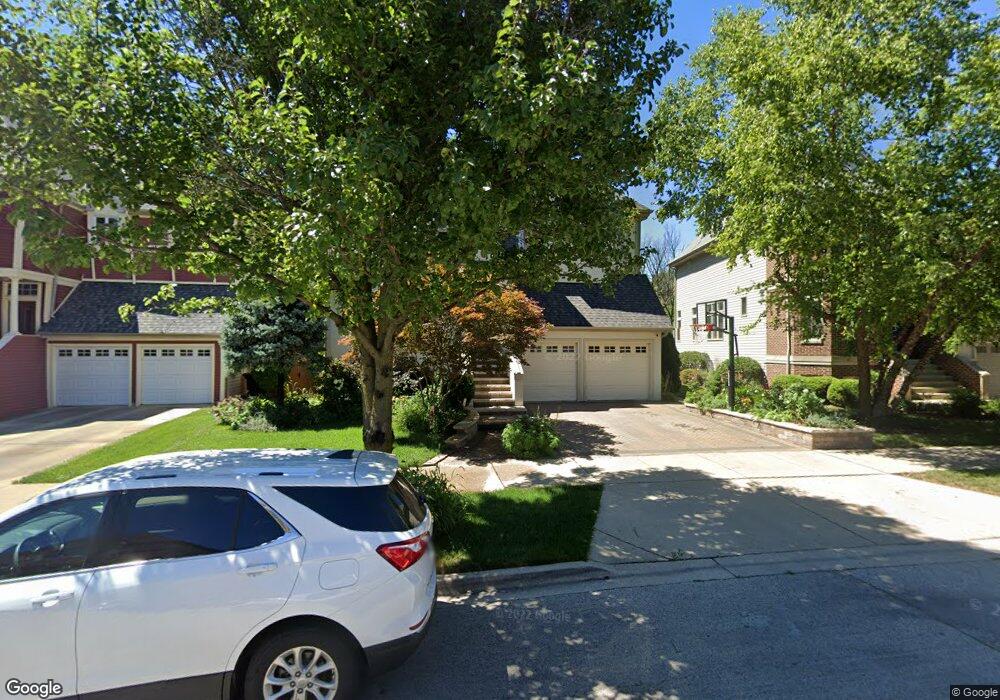
5458 N Lowell Ave Chicago, IL 60630
North Park NeighborhoodEstimated Value: $873,000 - $1,003,000
4
Beds
4
Baths
3,694
Sq Ft
$249/Sq Ft
Est. Value
About This Home
This home is located at 5458 N Lowell Ave, Chicago, IL 60630 and is currently estimated at $920,658, approximately $249 per square foot. 5458 N Lowell Ave is a home located in Cook County with nearby schools including Sauganash Elementary School, Taft High School, and CICS Northtown.
Ownership History
Date
Name
Owned For
Owner Type
Purchase Details
Closed on
Sep 11, 1998
Sold by
Bryn Mawr & Kostner Llc
Bought by
Flores Magno and Flores Prosperidad
Current Estimated Value
Home Financials for this Owner
Home Financials are based on the most recent Mortgage that was taken out on this home.
Original Mortgage
$351,000
Outstanding Balance
$76,020
Interest Rate
7.06%
Estimated Equity
$844,638
Create a Home Valuation Report for This Property
The Home Valuation Report is an in-depth analysis detailing your home's value as well as a comparison with similar homes in the area
Home Values in the Area
Average Home Value in this Area
Purchase History
| Date | Buyer | Sale Price | Title Company |
|---|---|---|---|
| Flores Magno | $400,000 | -- |
Source: Public Records
Mortgage History
| Date | Status | Borrower | Loan Amount |
|---|---|---|---|
| Open | Flores Magno | $351,000 |
Source: Public Records
Tax History Compared to Growth
Tax History
| Year | Tax Paid | Tax Assessment Tax Assessment Total Assessment is a certain percentage of the fair market value that is determined by local assessors to be the total taxable value of land and additions on the property. | Land | Improvement |
|---|---|---|---|---|
| 2024 | $13,975 | $79,001 | $19,296 | $59,705 |
| 2023 | $13,623 | $66,000 | $15,436 | $50,564 |
| 2022 | $13,623 | $66,000 | $15,436 | $50,564 |
| 2021 | $13,315 | $65,999 | $15,436 | $50,563 |
| 2020 | $14,272 | $63,846 | $7,993 | $55,853 |
| 2019 | $14,301 | $70,941 | $7,993 | $62,948 |
| 2018 | $14,059 | $70,941 | $7,993 | $62,948 |
| 2017 | $13,064 | $60,489 | $7,166 | $53,323 |
| 2016 | $12,156 | $60,489 | $7,166 | $53,323 |
| 2015 | $11,123 | $60,489 | $7,166 | $53,323 |
| 2014 | $11,848 | $63,624 | $6,615 | $57,009 |
| 2013 | $11,614 | $63,624 | $6,615 | $57,009 |
Source: Public Records
Map
Nearby Homes
- 5360 N Lowell Ave Unit 206
- 5360 N Lowell Ave Unit 502
- 5340 N Lowell Ave Unit 208
- 4401 W Hollywood Ave
- 5320 N Lowell Ave Unit 206
- 5665 N Rogers Ave
- 5148 N Kostner Ave
- 5158 N Keeler Ave
- 5810 N Kirby Ave
- 4551 W Foster Ave
- 4500 W Thorndale Ave
- 5832 N Kenton Ave
- 4272 W Harrington Ln
- 5019 N Kostner Ave
- 5019 N Kilbourn Ave
- 6022 N Ionia Ave
- 5944 N Knox Ave
- 5857 N Cicero Ave
- 9530 N Lamon Ave Unit 403
- 6053 N Keeler Ave
- 5452 N Lowell Ave
- 5502 N Lowell Ave
- 5448 N Lowell Ave
- 5508 N Lowell Ave
- 5442 N Lowell Ave
- 5501 N Lowell Ave
- 5503 N Lowell Ave
- 5514 N Lowell Ave
- 5455 N Lowell Ave
- 5436 N Lowell Ave
- 5449 N Lowell Ave
- 5520 N Lowell Ave
- 5512 N Kildare Ave
- 5518 N Kildare Ave
- 5506 N Kildare Ave
- 5430 N Lowell Ave
- 5443 N Lowell Ave
- 5526 N Lowell Ave
- 5500 N Kildare Ave
- 5500 N Kildare Ave