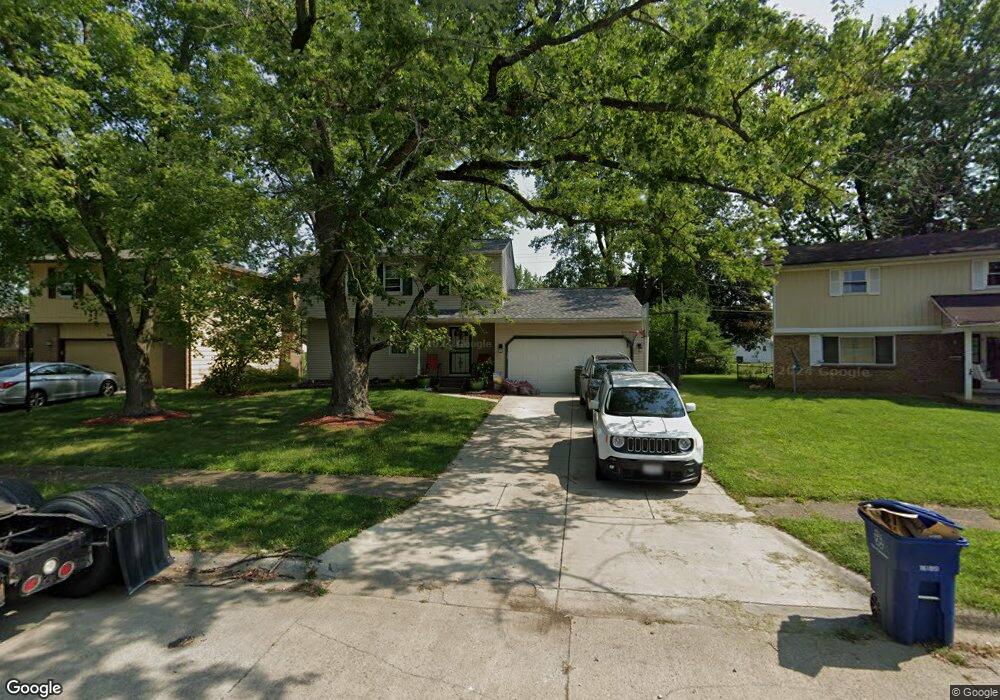
5458 Sumac Loop E Columbus, OH 43229
Forest Park East NeighborhoodEstimated Value: $293,000 - $340,000
4
Beds
3
Baths
1,768
Sq Ft
$184/Sq Ft
Est. Value
About This Home
This home is located at 5458 Sumac Loop E, Columbus, OH 43229 and is currently estimated at $325,808, approximately $184 per square foot. 5458 Sumac Loop E is a home located in Franklin County with nearby schools including Avalon Elementary School, Northgate Intermediate, and Woodward Park Middle School.
Ownership History
Date
Name
Owned For
Owner Type
Purchase Details
Closed on
Sep 16, 2025
Sold by
Foster Sonja and Spencer Dezia M
Bought by
Cogs Ultd Llc
Current Estimated Value
Home Financials for this Owner
Home Financials are based on the most recent Mortgage that was taken out on this home.
Original Mortgage
$50,000
Outstanding Balance
$50,000
Interest Rate
6.63%
Mortgage Type
Construction
Estimated Equity
$275,808
Purchase Details
Closed on
Nov 16, 2022
Sold by
Foster Sonja
Bought by
Foster Sonja and Spencer Dezia M
Purchase Details
Closed on
Nov 3, 2017
Sold by
Grove Kevin R
Bought by
Foster Glennda A and Foster Sonja
Home Financials for this Owner
Home Financials are based on the most recent Mortgage that was taken out on this home.
Original Mortgage
$145,809
Interest Rate
4.12%
Mortgage Type
FHA
Purchase Details
Closed on
May 16, 2017
Sold by
Jones Acoyia Q
Bought by
Grove Kevin R
Purchase Details
Closed on
Mar 24, 2003
Sold by
Oconnor L Kevin and Oconnor Billie J
Bought by
Grove Kevin R and Jones Acoyia Q
Home Financials for this Owner
Home Financials are based on the most recent Mortgage that was taken out on this home.
Original Mortgage
$127,877
Interest Rate
5.94%
Mortgage Type
FHA
Purchase Details
Closed on
Nov 29, 1991
Bought by
Oconnor L Kevin
Create a Home Valuation Report for This Property
The Home Valuation Report is an in-depth analysis detailing your home's value as well as a comparison with similar homes in the area
Home Values in the Area
Average Home Value in this Area
Purchase History
| Date | Buyer | Sale Price | Title Company |
|---|---|---|---|
| Cogs Ultd Llc | $225,000 | Equity Settlement Services | |
| Foster Sonja | -- | Gahanna Title | |
| Foster Glennda A | $148,500 | Elite Land Title | |
| Grove Kevin R | -- | None Available | |
| Grove Kevin R | $129,800 | -- | |
| Oconnor L Kevin | $94,000 | -- |
Source: Public Records
Mortgage History
| Date | Status | Borrower | Loan Amount |
|---|---|---|---|
| Open | Cogs Ultd Llc | $50,000 | |
| Previous Owner | Foster Glennda A | $145,809 | |
| Previous Owner | Grove Kevin R | $127,877 |
Source: Public Records
Tax History
| Year | Tax Paid | Tax Assessment Tax Assessment Total Assessment is a certain percentage of the fair market value that is determined by local assessors to be the total taxable value of land and additions on the property. | Land | Improvement |
|---|---|---|---|---|
| 2025 | $3,868 | $86,180 | $19,220 | $66,960 |
| 2024 | $3,868 | $86,180 | $19,220 | $66,960 |
| 2023 | $3,818 | $86,180 | $19,220 | $66,960 |
| 2022 | $3,061 | $59,010 | $12,250 | $46,760 |
| 2021 | $3,066 | $59,010 | $12,250 | $46,760 |
| 2020 | $3,070 | $59,010 | $12,250 | $46,760 |
| 2019 | $2,614 | $43,090 | $9,100 | $33,990 |
| 2018 | $2,609 | $43,090 | $9,100 | $33,990 |
| 2017 | $2,617 | $43,090 | $9,100 | $33,990 |
| 2016 | $2,623 | $39,590 | $8,540 | $31,050 |
| 2015 | $2,381 | $39,590 | $8,540 | $31,050 |
| 2014 | $2,387 | $39,590 | $8,540 | $31,050 |
| 2013 | $1,240 | $41,685 | $8,995 | $32,690 |
Source: Public Records
Map
Nearby Homes
- 2087 Teakwood Dr
- 5556 Parkshire Dr Unit 5556
- 5726 Beechcroft Rd Unit J
- 5732 Beechcroft Rd Unit B
- 5720 Beechcroft Rd Unit B
- 1862 Torchwood Dr
- 2251 Tuliptree Ave
- 5486 Pine Bluff Rd
- 5705 Pine Tree St S Unit F
- 5885 Beechcroft Rd Unit 306
- 5885 Beechcroft Rd Unit 114
- 5972 Maple Canyon Ave
- 1687 Brookfield Square S
- 6019 Beechcroft Rd
- 2470 Carolina Ave Unit 66
- 1638 Arrowood Loop N
- 5092 Riverbirch Dr N
- 6048 Pinemoor St
- 5575 Karl Rd
- 1905 Denise Dr
- 5458 Sumac Loop S
- 5466 Sumac Loop E
- 5452 Sumac Loop E
- 5474 Sumac Loop E
- 5453 Aqua St
- 5445 Aqua St
- 5461 Aqua St
- 2154 Sumac Loop S
- 5439 Aqua St
- 2165 Sumac Loop S
- 5467 Aqua St
- 5427 Aqua St
- 2155 Sumac Loop N
- 5482 Sumac Loop E
- 2159 Sumac Loop S
- 5479 Aqua St
- 2144 Sumac Loop S
- 5419 Aqua St
- 2149 Sumac Loop S
- 2145 Sumac Loop N
Your Personal Tour Guide
Ask me questions while you tour the home.