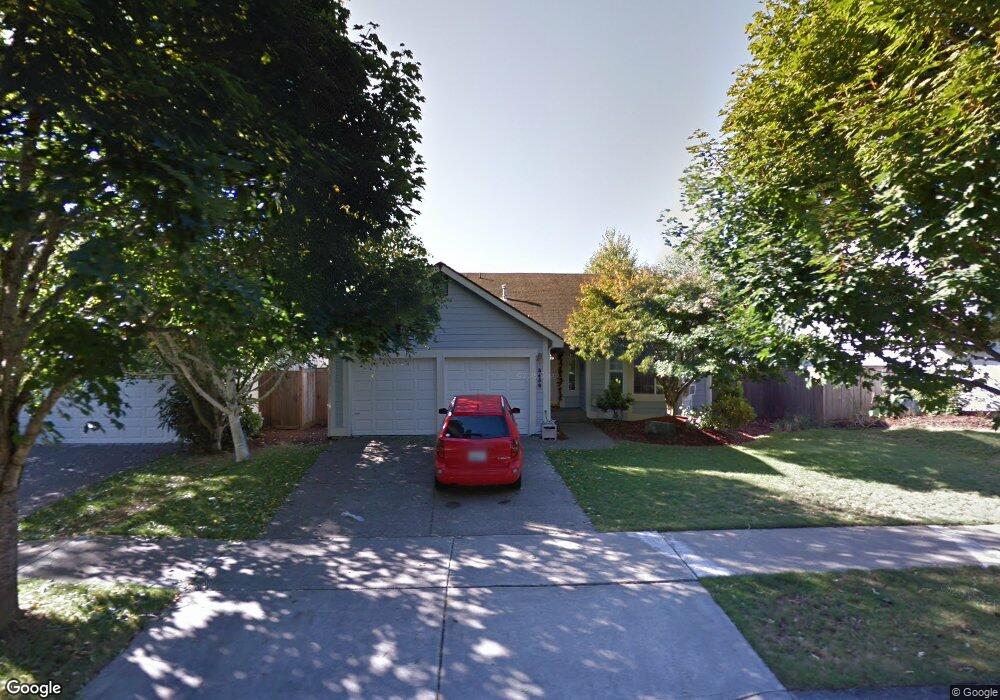
5459 Komachin Loop SE Lacey, WA 98513
The Lakes NeighborhoodEstimated Value: $447,732 - $477,000
3
Beds
2
Baths
1,392
Sq Ft
$335/Sq Ft
Est. Value
About This Home
This home is located at 5459 Komachin Loop SE, Lacey, WA 98513 and is currently estimated at $466,183, approximately $334 per square foot. 5459 Komachin Loop SE is a home located in Thurston County with nearby schools including Lakes Elementary School, Komachin Middle School, and Timberline High School.
Ownership History
Date
Name
Owned For
Owner Type
Purchase Details
Closed on
Jul 14, 2010
Sold by
Harlew Diana Lee
Bought by
Harlow Diana Lee and Robert Gerald Harlow Credit Shelter Trus
Current Estimated Value
Purchase Details
Closed on
Jun 12, 2009
Sold by
Harlow Robert G and Harlow Diana L
Bought by
Harlow Robert Gerald and Harlow Diana Lee
Purchase Details
Closed on
Sep 20, 2001
Sold by
Bly Lacount A and Bly Danika Y
Bought by
Harlow Robert G and Harlow Diana L
Purchase Details
Closed on
Sep 25, 1997
Sold by
Gemini Corp
Bought by
Bly Lacount A and Bly Danika Y
Home Financials for this Owner
Home Financials are based on the most recent Mortgage that was taken out on this home.
Original Mortgage
$122,349
Interest Rate
7.44%
Mortgage Type
VA
Create a Home Valuation Report for This Property
The Home Valuation Report is an in-depth analysis detailing your home's value as well as a comparison with similar homes in the area
Home Values in the Area
Average Home Value in this Area
Purchase History
| Date | Buyer | Sale Price | Title Company |
|---|---|---|---|
| Harlow Diana Lee | -- | None Available | |
| Harlow Robert Gerald | -- | None Available | |
| Harlow Robert G | $133,000 | Chicago Title Insurance Comp | |
| Bly Lacount A | $119,950 | First American Title Ins Co |
Source: Public Records
Mortgage History
| Date | Status | Borrower | Loan Amount |
|---|---|---|---|
| Previous Owner | Bly Lacount A | $122,349 |
Source: Public Records
Tax History Compared to Growth
Tax History
| Year | Tax Paid | Tax Assessment Tax Assessment Total Assessment is a certain percentage of the fair market value that is determined by local assessors to be the total taxable value of land and additions on the property. | Land | Improvement |
|---|---|---|---|---|
| 2024 | $3,678 | $398,500 | $135,400 | $263,100 |
| 2023 | $3,678 | $384,500 | $114,600 | $269,900 |
| 2022 | $3,584 | $370,000 | $76,700 | $293,300 |
| 2021 | $3,167 | $307,900 | $83,400 | $224,500 |
| 2020 | $2,890 | $253,400 | $79,100 | $174,300 |
| 2019 | $2,504 | $240,200 | $69,100 | $171,100 |
| 2018 | $2,747 | $204,500 | $45,200 | $159,300 |
| 2017 | $2,496 | $195,650 | $43,850 | $151,800 |
| 2016 | $2,385 | $183,550 | $48,150 | $135,400 |
| 2014 | -- | $182,350 | $48,150 | $134,200 |
Source: Public Records
Map
Nearby Homes
- 5415 Komachin Loop SE
- 6441 Jeffrey Ct SE
- 6427 Candace Ct SE
- 5402 Kendra Ct SE
- 5611 Vincent Ct SE
- 4748 Lakeshore Ln SE Unit B
- 5614 Vincent Ct SE
- 6045 Mullen Rd SE
- 7007 Mullen Rd SE
- 6112 Thornbury Ct SE
- 6822 57th Ct SE
- 6011 Mullen Rd SE Unit A & B
- 5314 Narada Ct SE
- 5509 Topaz St SE
- 4936 Cottage Ln SE
- 6008 Thornbury Dr SE
- 4927 Cottage Ln SE
- 5649 45th Ave SE
- 4500 Ruddell Rd SE Unit 40
- 4500 Ruddell Rd SE Unit 32
- 5455 Komachin Loop SE
- 5463 Komachin Loop SE
- 5107 Jessica Ct SE
- 5451 Komachin Loop SE
- 6429 Tyler Ct SE
- 5111 Jessica Ct SE
- 5447 Komachin Loop SE
- 5458 Komachin Loop SE
- 5443 Komachin Loop SE
- 5454 Komachin Loop SE
- 5104 Jessica Ct SE
- 5108 Jessica Ct SE
- 5100 Jessica Ct SE
- 5439 Komachin Loop SE
- 5112 Jessica Ct SE
- 6308 Tyler Ct SE
- 6305 Tyler Ct SE
- 5116 Jessica Ct SE
- 5505 Komachin Loop SE
- 6304 Wade Ct SE