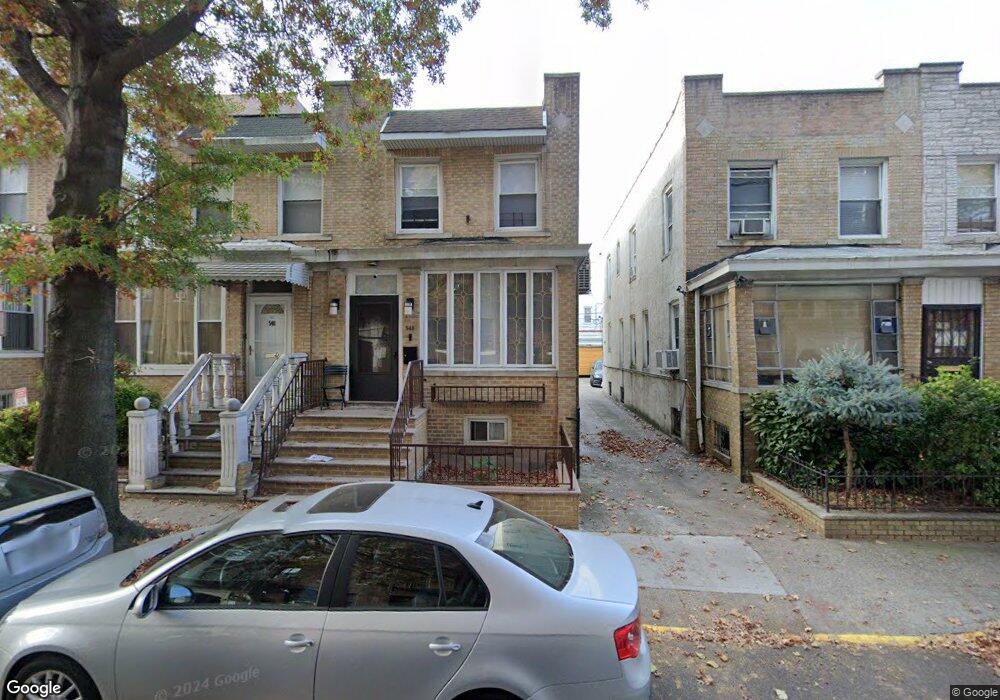
546 85th St Unit Building Brooklyn, NY 11209
Bay Ridge NeighborhoodEstimated Value: $1,207,727 - $1,379,000
--
Bed
2
Baths
1,558
Sq Ft
$833/Sq Ft
Est. Value
About This Home
This home is located at 546 85th St Unit Building, Brooklyn, NY 11209 and is currently estimated at $1,298,182, approximately $833 per square foot. 546 85th St Unit Building is a home located in Kings County with nearby schools including P.S./I.S. 104 The Fort Hamilton School, P.S. 264 Bay Ridge Elementary School for the Arts, and Fort Hamilton High School.
Ownership History
Date
Name
Owned For
Owner Type
Purchase Details
Closed on
Dec 11, 2023
Sold by
Mohamed Sabah and Mohshen Ibrahim
Bought by
Lin Qingfang
Current Estimated Value
Home Financials for this Owner
Home Financials are based on the most recent Mortgage that was taken out on this home.
Original Mortgage
$590,000
Outstanding Balance
$580,094
Interest Rate
7.44%
Mortgage Type
Purchase Money Mortgage
Estimated Equity
$718,088
Purchase Details
Closed on
Oct 3, 2005
Sold by
Estate Of Jacob Romansic and Romansic Conway
Bought by
Mohamed Sabah and Mohamed Mohsen Ibrahim
Home Financials for this Owner
Home Financials are based on the most recent Mortgage that was taken out on this home.
Original Mortgage
$56,500
Interest Rate
5.78%
Create a Home Valuation Report for This Property
The Home Valuation Report is an in-depth analysis detailing your home's value as well as a comparison with similar homes in the area
Home Values in the Area
Average Home Value in this Area
Purchase History
| Date | Buyer | Sale Price | Title Company |
|---|---|---|---|
| Lin Qingfang | $1,180,000 | -- | |
| Mohamed Sabah | $565,000 | -- | |
| Mohamed Sabah | $565,000 | -- |
Source: Public Records
Mortgage History
| Date | Status | Borrower | Loan Amount |
|---|---|---|---|
| Open | Lin Qingfang | $590,000 | |
| Previous Owner | Mohamed Sabah | $56,500 | |
| Previous Owner | Mohamed Sabah | $452,000 |
Source: Public Records
Tax History Compared to Growth
Tax History
| Year | Tax Paid | Tax Assessment Tax Assessment Total Assessment is a certain percentage of the fair market value that is determined by local assessors to be the total taxable value of land and additions on the property. | Land | Improvement |
|---|---|---|---|---|
| 2025 | $8,310 | $67,920 | $10,440 | $57,480 |
| 2024 | $8,310 | $65,400 | $10,440 | $54,960 |
| 2023 | $3,964 | $69,240 | $10,440 | $58,800 |
| 2022 | $7,352 | $57,420 | $10,440 | $46,980 |
| 2021 | $7,750 | $63,000 | $10,440 | $52,560 |
| 2020 | $3,823 | $68,160 | $10,440 | $57,720 |
| 2019 | $7,212 | $62,520 | $10,440 | $52,080 |
| 2018 | $6,631 | $32,529 | $5,009 | $27,520 |
| 2017 | $6,256 | $30,688 | $5,900 | $24,788 |
| 2016 | $6,135 | $30,688 | $6,819 | $23,869 |
| 2015 | $3,492 | $30,455 | $9,715 | $20,740 |
| 2014 | $3,492 | $28,732 | $11,002 | $17,730 |
Source: Public Records
Map
Nearby Homes
- 546 85th St
- 542 85th St
- 546 85 St
- 548 85th St
- 546 85 Th St
- 552 85th St
- 540 85th St
- 554 85th St
- 536 85th St
- 534 85th St
- 534 85th St Unit 2
- 541 86th St
- 539 86th St
- 8502 Ft Hamilton Pkwy Unit 4B
- 8502 Ft Hamilton Pkwy Unit 4H
- 8502 Ft Hamilton Pkwy Unit 4A
- 8502 Ft Hamilton Pkwy Unit 3G
- 537 86th St
- 530 85th St
- 547 86th St Unit 2