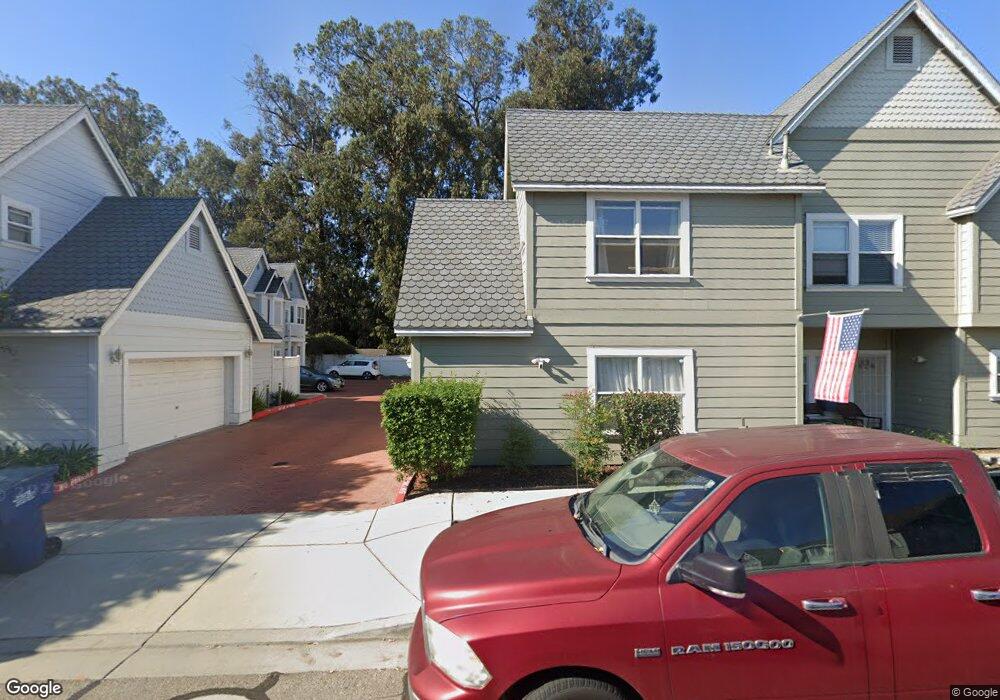
546 Adina Way Nipomo, CA 93444
Estimated Value: $462,000 - $521,000
2
Beds
2
Baths
969
Sq Ft
$504/Sq Ft
Est. Value
About This Home
This home is located at 546 Adina Way, Nipomo, CA 93444 and is currently estimated at $488,192, approximately $503 per square foot. 546 Adina Way is a home located in San Luis Obispo County with nearby schools including Dorothea Lange Elementary School, Mesa Middle School, and Nipomo High School.
Ownership History
Date
Name
Owned For
Owner Type
Purchase Details
Closed on
May 20, 2010
Sold by
Deutsche Bank National Trust Company
Bought by
Hampton Carol J
Current Estimated Value
Purchase Details
Closed on
Apr 1, 2010
Sold by
Olsen Donald A
Bought by
Deutsche Bank National Trust Company
Purchase Details
Closed on
Dec 2, 2005
Sold by
Olsen Donald A
Bought by
Slotown Properties Llc
Purchase Details
Closed on
Mar 17, 2005
Sold by
Flynn Kathryn R
Bought by
Olsen Donald A
Home Financials for this Owner
Home Financials are based on the most recent Mortgage that was taken out on this home.
Original Mortgage
$235,550
Interest Rate
5.84%
Mortgage Type
Fannie Mae Freddie Mac
Purchase Details
Closed on
Jun 17, 2003
Sold by
Nipomo Village Llc
Bought by
Flynn Kathryn R
Home Financials for this Owner
Home Financials are based on the most recent Mortgage that was taken out on this home.
Original Mortgage
$177,675
Interest Rate
5.18%
Mortgage Type
Purchase Money Mortgage
Create a Home Valuation Report for This Property
The Home Valuation Report is an in-depth analysis detailing your home's value as well as a comparison with similar homes in the area
Home Values in the Area
Average Home Value in this Area
Purchase History
| Date | Buyer | Sale Price | Title Company |
|---|---|---|---|
| Hampton Carol J | $156,000 | Lsi Title Company Ca | |
| Deutsche Bank National Trust Company | $121,600 | Accommodation | |
| Slotown Properties Llc | -- | None Available | |
| Olsen Donald A | $336,500 | Fidelity Title Company | |
| Flynn Kathryn R | $172,500 | Fidelity Title Company |
Source: Public Records
Mortgage History
| Date | Status | Borrower | Loan Amount |
|---|---|---|---|
| Previous Owner | Olsen Donald A | $235,550 | |
| Previous Owner | Flynn Kathryn R | $177,675 | |
| Closed | Olsen Donald A | $67,300 |
Source: Public Records
Tax History Compared to Growth
Tax History
| Year | Tax Paid | Tax Assessment Tax Assessment Total Assessment is a certain percentage of the fair market value that is determined by local assessors to be the total taxable value of land and additions on the property. | Land | Improvement |
|---|---|---|---|---|
| 2025 | $2,071 | $201,350 | $96,803 | $104,547 |
| 2024 | $2,047 | $197,403 | $94,905 | $102,498 |
| 2023 | $2,047 | $193,534 | $93,045 | $100,489 |
| 2022 | $2,016 | $189,740 | $91,221 | $98,519 |
| 2021 | $2,013 | $186,021 | $89,433 | $96,588 |
| 2020 | $1,990 | $184,114 | $88,516 | $95,598 |
| 2019 | $1,978 | $180,505 | $86,781 | $93,724 |
| 2018 | $1,954 | $176,967 | $85,080 | $91,887 |
| 2017 | $1,917 | $173,498 | $83,412 | $90,086 |
| 2016 | $1,808 | $170,097 | $81,777 | $88,320 |
| 2015 | $1,783 | $167,543 | $80,549 | $86,994 |
| 2014 | $1,716 | $164,262 | $78,972 | $85,290 |
Source: Public Records
Map
Nearby Homes
- 450 Avenida de Socios Unit 12
- 626 Juno Ct
- 368 Avenida de Amigos
- 525 Grande Ave Unit D
- 424 Bermuda Place
- 483 Violet Ave
- 725 Monarch Ln
- 232 Scarlett Cir
- 522 Higos Way
- Mesa Plan at Hill Street Terraces - Hill Street Series
- Pacific Plan at Hill Street Terraces - Hill Street Series
- Monarch Plan at Hill Street Terraces - Hill Street Series
- Rancho Plan at Hill Street Terraces - Hill Street Series
- Dana Plan at Hill Street Terraces - Hill Street Series
- 449 W Tefft St Unit 23
- 449 W Tefft St Unit 13
- 680 Hill St
- 840 Story St
- 90111003 W Price St
- 160 San Antonio Ln
- 544 Adina Way
- 548 Adina Way
- 540 Adina Way
- 536 Adina Way
- 534 Adina Way
- 556 Adina Way
- 538 Adina Way
- 554 Adina Way
- 550 Adina Way
- 519 Avenida Montecito Verde
- 515 Avenida Montecito Verde
- 560 Adina Way
- 566 Adina Way
- 564 Adina Way
- 568 Adina Way
- 523 Avenida Montecito Verde
- 526 Adina Way
- 520 Adina Way
- 528 Adina Way