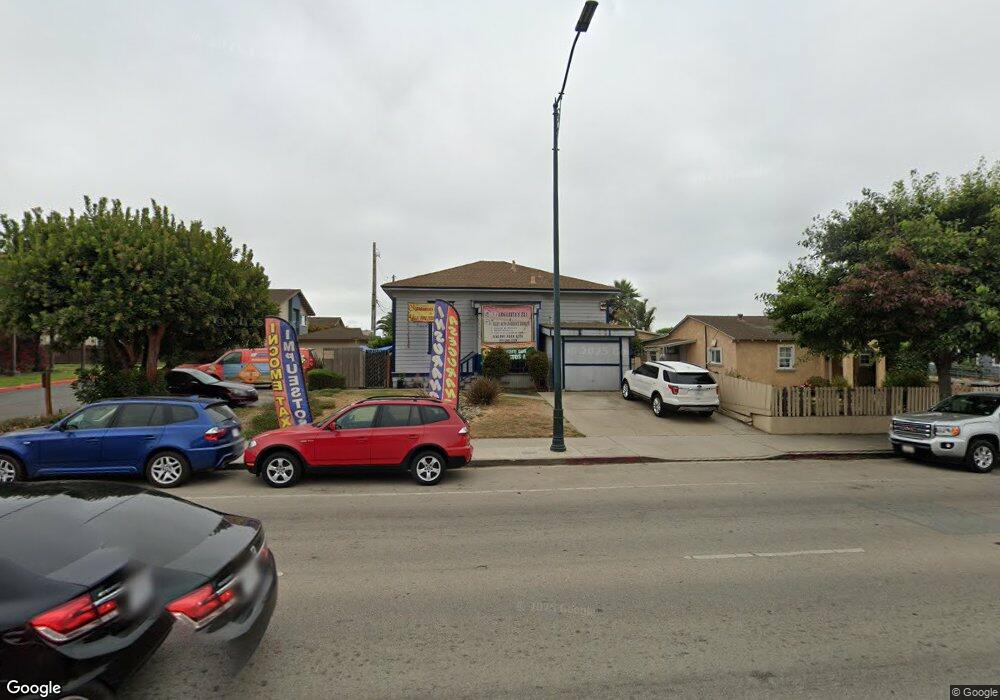
546 E Market St Salinas, CA 93905
East Salinas NeighborhoodEstimated Value: $686,284
Studio
--
Bath
1,606
Sq Ft
$427/Sq Ft
Est. Value
About This Home
This home is located at 546 E Market St, Salinas, CA 93905 and is currently estimated at $686,284, approximately $427 per square foot. 546 E Market St is a home with nearby schools including Sherwood Elementary School, Los Padres Elementary School, and Washington Middle School.
Ownership History
Date
Name
Owned For
Owner Type
Purchase Details
Closed on
Nov 22, 2022
Sold by
Soria Jose and Soria Marizela
Bought by
Soria Family Trust
Current Estimated Value
Purchase Details
Closed on
Mar 22, 2007
Sold by
Soria Jose and Soria Marizela
Bought by
Soria Jose and Soria Marizela
Purchase Details
Closed on
Dec 15, 2004
Sold by
Palma Jose V and Palma Anabel
Bought by
Soria Jose and Soria Marizela
Purchase Details
Closed on
Jan 13, 2003
Sold by
Community Housing Improvement System & P
Bought by
Palma Jose V and Palma Anabel
Create a Home Valuation Report for This Property
The Home Valuation Report is an in-depth analysis detailing your home's value as well as a comparison with similar homes in the area
Home Values in the Area
Average Home Value in this Area
Purchase History
| Date | Buyer | Sale Price | Title Company |
|---|---|---|---|
| Soria Family Trust | -- | -- | |
| Soria Jose | -- | None Available | |
| Soria Jose | $475,000 | Chicago Title | |
| Palma Jose V | $200,000 | Chicago Title |
Source: Public Records
Tax History
| Year | Tax Paid | Tax Assessment Tax Assessment Total Assessment is a certain percentage of the fair market value that is determined by local assessors to be the total taxable value of land and additions on the property. | Land | Improvement |
|---|---|---|---|---|
| 2025 | $7,577 | $662,091 | $383,319 | $278,772 |
| 2024 | $7,577 | $649,109 | $375,803 | $273,306 |
| 2023 | $7,322 | $636,383 | $368,435 | $267,948 |
| 2022 | $7,050 | $623,906 | $361,211 | $262,695 |
| 2021 | $6,772 | $611,674 | $354,129 | $257,545 |
| 2020 | $6,584 | $605,403 | $350,498 | $254,905 |
| 2019 | $6,539 | $593,533 | $343,626 | $249,907 |
| 2018 | $6,458 | $581,896 | $336,889 | $245,007 |
| 2017 | $6,464 | $570,487 | $330,284 | $240,203 |
| 2016 | $6,469 | $559,302 | $323,808 | $235,494 |
| 2015 | $6,526 | $550,902 | $318,945 | $231,957 |
| 2014 | $6,086 | $540,112 | $312,698 | $227,414 |
Source: Public Records
Map
Nearby Homes
- 487 E Market St
- 129 N Filice St
- 150 Kern St Unit 114
- 150 Kern St Unit 40
- 158 Kern St Unit 11
- 166 Kern St Unit 19
- 166 Kern St Unit 18
- 182 Kern St Unit 45
- 190 Kern St Unit 48
- 724 Circle Dr
- 320 N Sanborn Rd
- 544 Saint George Dr
- 609 Saint George Dr
- 234 Cherry Dr
- 11 Hill Cir
- 11 E Laurel Dr
- 1 Santa Lucia Ave
- 933 Acosta Plaza Unit 35
- 13 E Lake St
- 230 Martella St
- 540 E Market St
- 544 E Market St Unit A
- 544 E Market St Unit C
- 600 E Market St
- 604 E Market St
- 109 Carr Ave
- 527 E Market St
- 86 Ragsdale Ct
- 113 Carr Ave
- 88 Ragsdale Ct
- 92 Ragsdale Ct
- 521 E Market St
- 119 Carr Ave
- 96 Ragsdale Ct Unit A
- 538 Fremont St
- 534 Fremont St
- 82 Ragsdale Ct
- 100 Ragsdale Ct
- 530 Fremont St
- 526 Fremont St
Your Personal Tour Guide
Ask me questions while you tour the home.